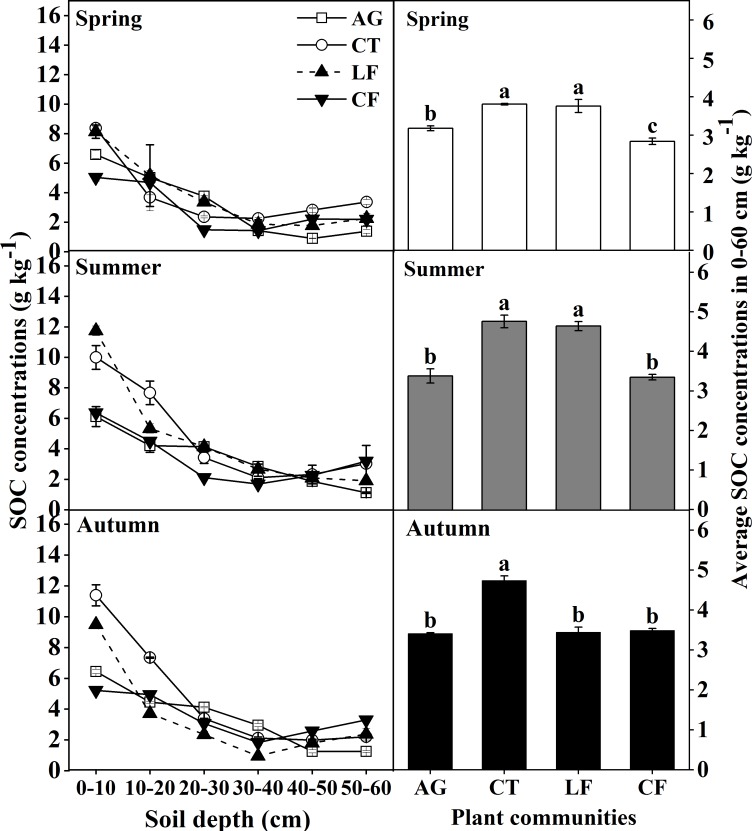
Fig 2. The distribution of SOC concentration at varying soil depths in the 0–60 cm layer.
Bars indicate a significant difference (n = 4, p<0.05) at the same soil depths between different plant communities, as determined by ANOVA; AG: alfalfa grassland, CT: Chinese tamarisk, LF: locust forest and CF: cotton field.

