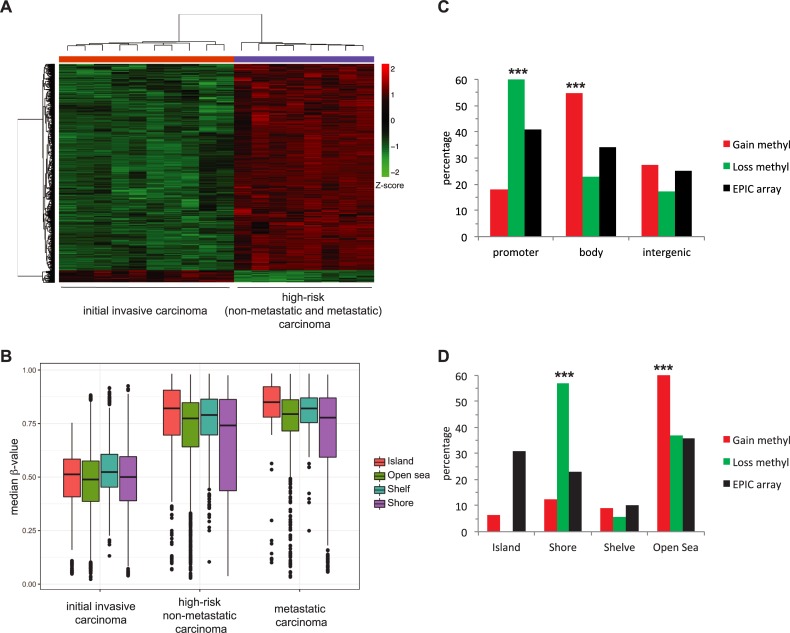
Fig 3. Comparison of DNA-methylation pattern between low-risk and high-risk stages.
A) Heatmap with the results of the elastic net analysis for differential methylation between low-risk initial invasive and high risk non-metastatic and metastatic cutaneous squamous cell carcinoma (cSCC) stages. Z-score colour scale ranges from green for lower methylation to red for higher methylation levels. B) DNA methylation median β-values of the different epigenomic substructures in the different groups of sCCC. Box plots indicate highly significant (p < 0.001, two-sided t-test) hypermethylation of all substructures in both high-risk non-metastatic and metastatic groups compared to low-risk initial invasive cSCC samples. C) Distribution of selected differentially methylated CpGs in high-risk compared to low-risk cSCC (hypomethylated in green and hypermethylated in red) and total CpG in the Illumina DNA methylation EPIC array in genes, promoters, gene body or intergenic regions. D) Distribution of differentially methylated CpGs in CpG islands, shore, shelf or open sea.

