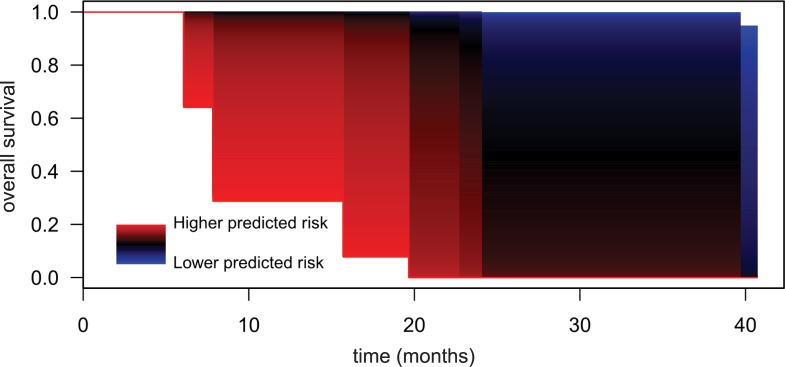
Fig 5. Survival model based on a prognosis DNA-methylation signature.
Representation of the predicted survival curves in patients with cSCC for different estimated risk values by the regression model using 32 CpGs. Patients with higher predicted risk levels show sizeably lower overall survival (OS) in comparison with patients with lower predicted risk levels.

