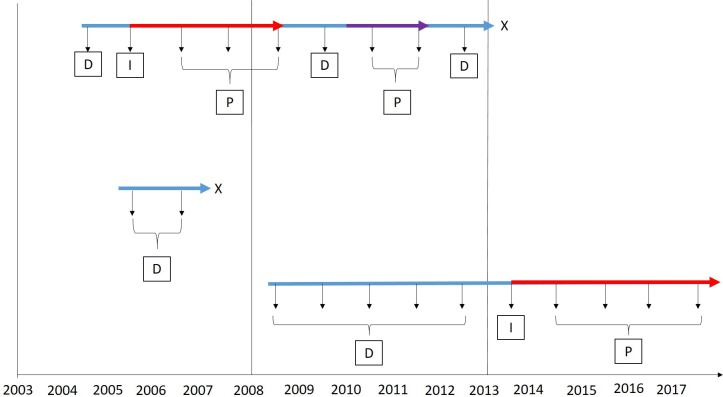
Figure 2.
Illustration showing how patients may contribute to the different groups for incidence and prevalence. The blue arrows show total unexposed time in the study; the red arrows indicate exposure to warfarin; the purple arrow indicates exposure to DOAC. The vertical arrows show the yearly incidence and prevalence calculations, and the letters in boxes correspond to the group the patient would contribute to for that year. Incidence and prevalence for the first D then prevalence only for all subsequent Ds. D, denominator; DOAC, direct oral anticoagulant; I, incidence numerator, P, prevalence numerator; X, left the study.

