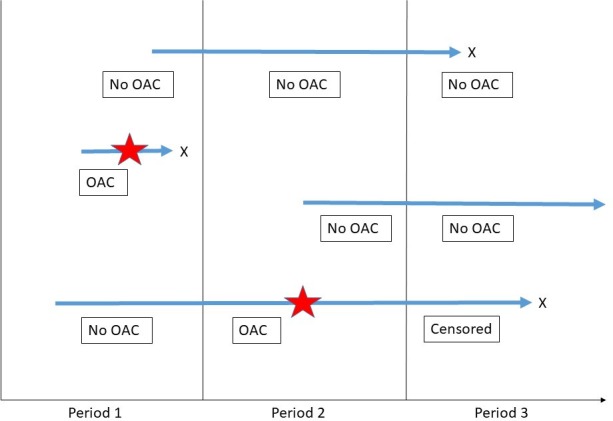
Figure 3.

Illustration showing how patients contribute to different groups for the characteristic comparisons during their time in the study. The blue arrows represent individual patients; the stars represent the date the index OAC was commenced; X represents the patient leaving the study. The boxes describe which group the patient will contribute comorbidity data to for that period (OAC will be subdivided to warfarin or direct oral anticoagulant, depending on which was prescribed). OAC, oral anticoagulant.
