
Figure 2.
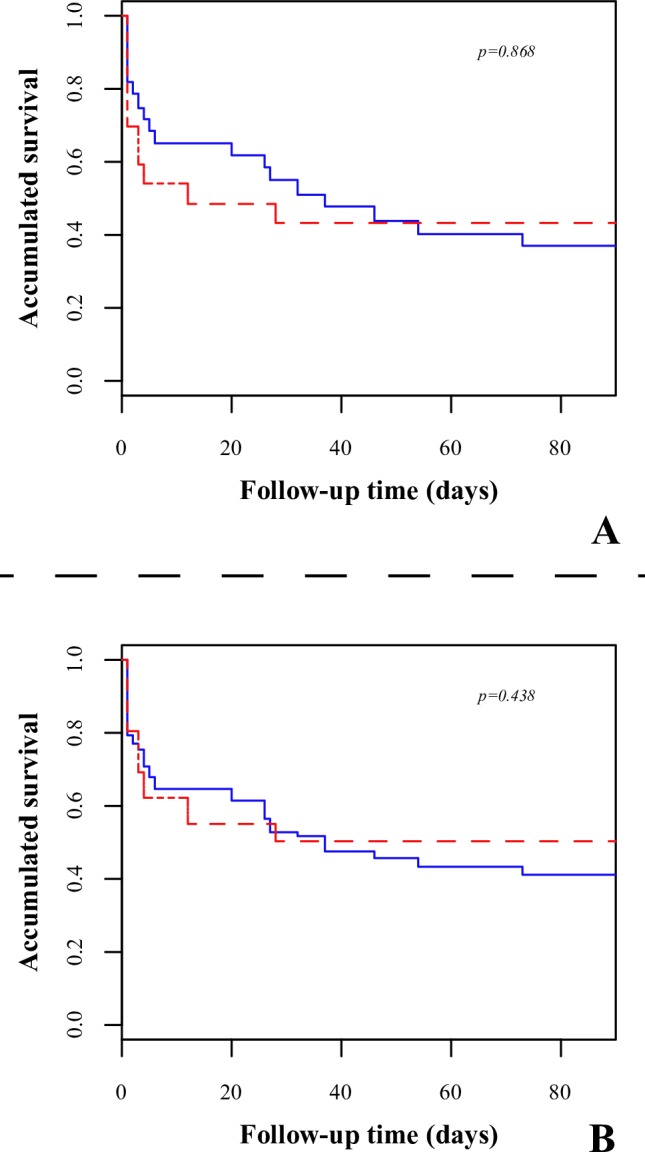
Survival analysis using the Kaplan-Meier estimator comparing both groups. Red, intervention; blue, control. A, intention to treat; B, real intervention.
Official websites use .gov
A
.gov website belongs to an official
government organization in the United States.
Secure .gov websites use HTTPS
A lock (
) or https:// means you've safely
connected to the .gov website. Share sensitive
information only on official, secure websites.
Survival analysis using the Kaplan-Meier estimator comparing both groups. Red, intervention; blue, control. A, intention to treat; B, real intervention.