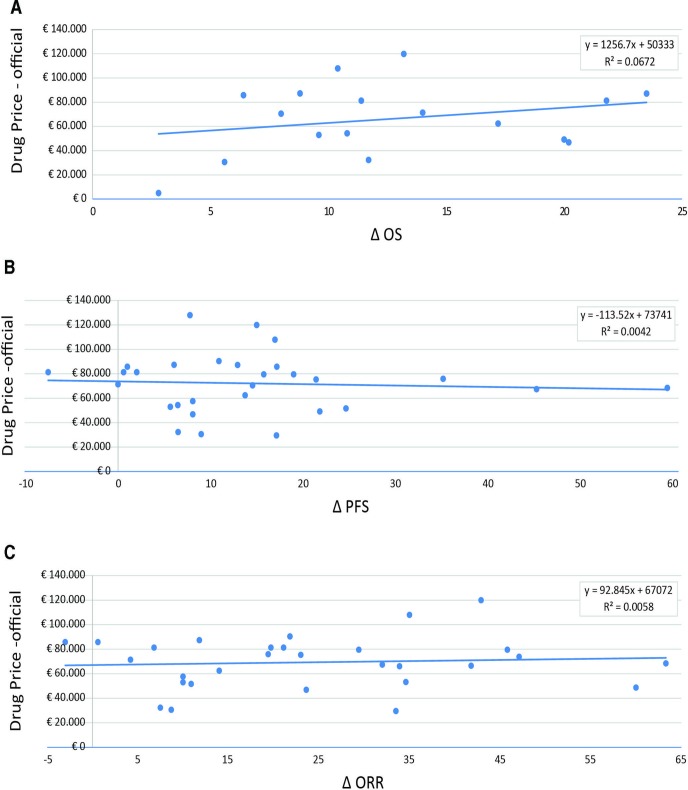
Figure 1.
Correlation between anticancer drug prices (officially negotiated) and health benefits. (A) Official negotiated price (ex-factory) versus difference in median OS (16 drugs are included in the analysis: 15 with a single indication and 1 with two indications). (B) Official negotiated price (ex-factory) versus difference in median PFS (25 drugs are included in the analysis: 22 with a single indication, 2 with two indications and 1 with three indication). (C) Official negotiated price (ex-factory) versus proportion of ORR (24 drugs are included in the analysis: 20 with a single indication, 3 with two indications and 1 with three indications). OS, overall survival; ORR, objective response rate; PFS, progression-free survival.

