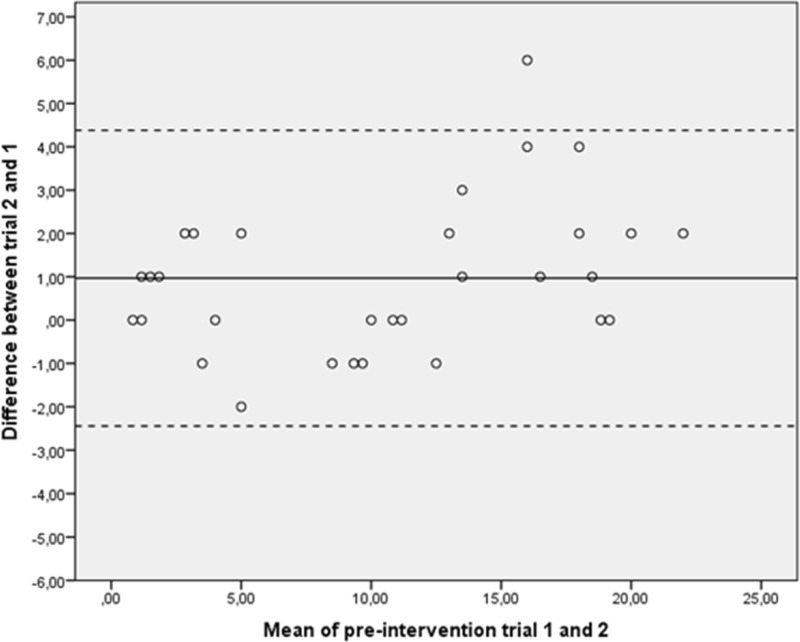
Figure 3.
Bland-Altman plots of numbers of pegs from preintervention trials. The mean of trials 1 and 2 was plotted against the difference of trials 2 and 1 for each subject. The centre line displays the mean difference for the group between trials 2 and 1. The upper and lower confidence limits were calculated as the mean difference±SD of the mean difference ×1.96.

