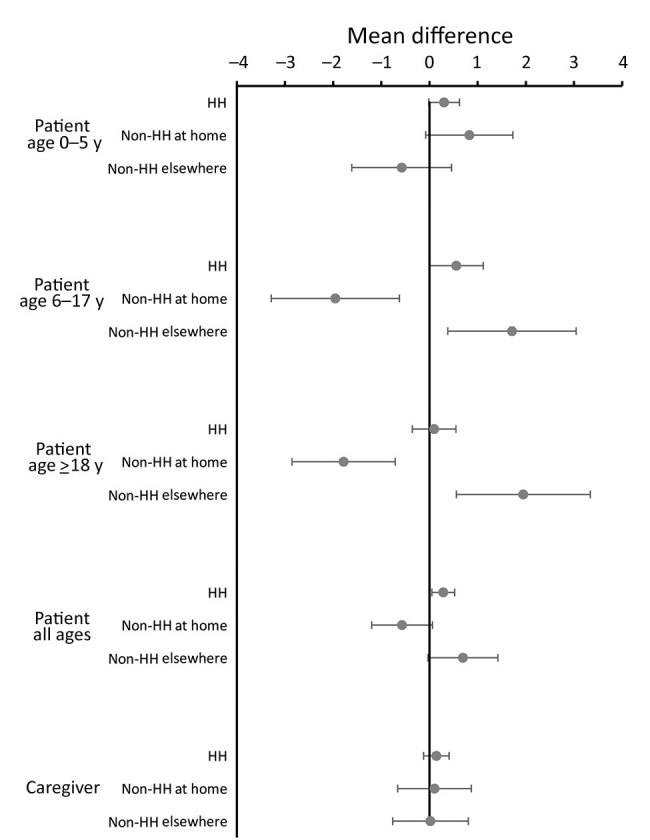
Figure 3.

Mean differences in numbers of HH member contacts and non-HH members seen as contacts at the home and elsewhere by study participants when well compared with when ill (the day after the clinic visit), restricted to persons seen on the same day of the week when well and when ill, in study of the effect of acute illness on contact patterns, Malawi, 2017. Mean difference >0 implies more contacts when well; mean difference <0 implies more contacts when ill. Error bars indicate 95% CIs. HH, household.
