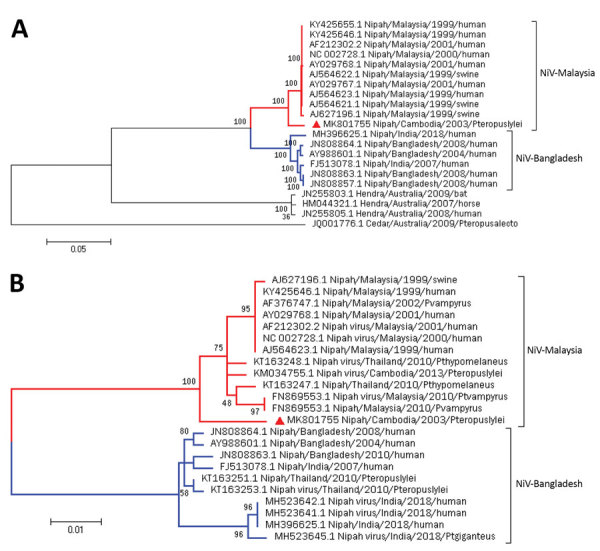
Figure 1.

Maximum-likelihood phylogenetic analysis of NiV CSUR381, Cambodia, 2003 (red triangle), compared with other henipaviruses and NiVs. A) Phylogenetic tree constructed with complete genome sequences. A general time-reversible model was calculated as the best DNA model to conduct this analysis. B) Phylogenetic tree constructed by using the nucleocapsid gene. The Kimura 2-parameter model was calculated as the best DNA model to conduct this analysis. Bootstrap statistical support is marked on branch nodes. GenBank accession numbers of isolates are provided in branches, and NiV lineages of isolates are indicated. Phylogenetic trees are drawn to scale; scale bars represent branch lengths measured in the number of substitutions per site. NiV, Nipah virus.
