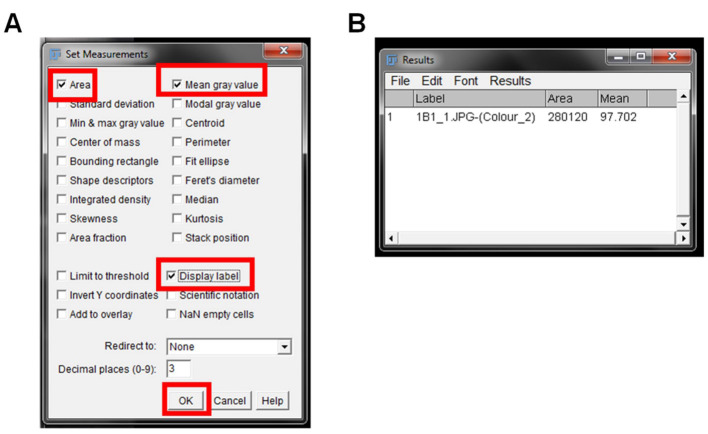
Figure 5. Measurement of DAB staining.
The Set Measurements window to choose the options for output of each IHC image is shown. The suggested options for output are highlighted with red boxes (A). The Results output window is shown in (B), and contains the name of the image (Label), area of the image (Area), and mean grey value intensity (Mean).

