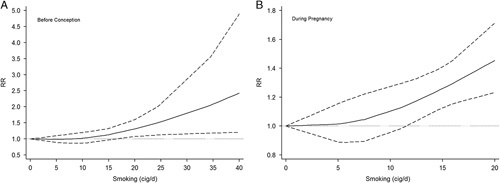
FIGURE 4.

A, Dose-response curve by restricted cubic spline model (smoking before conception). The solid line is the fitted line, dash lines are the lines for 95% confidence interval, and dot line is the reference line. B, Dose-response curve by restricted cubic spline model (smoking during pregnancy). The solid line is the fitted line, dash lines are the lines for 95% confidence interval, and dot line is the reference line. cig/d indicates cigarette per day; RR, risk ratio.
