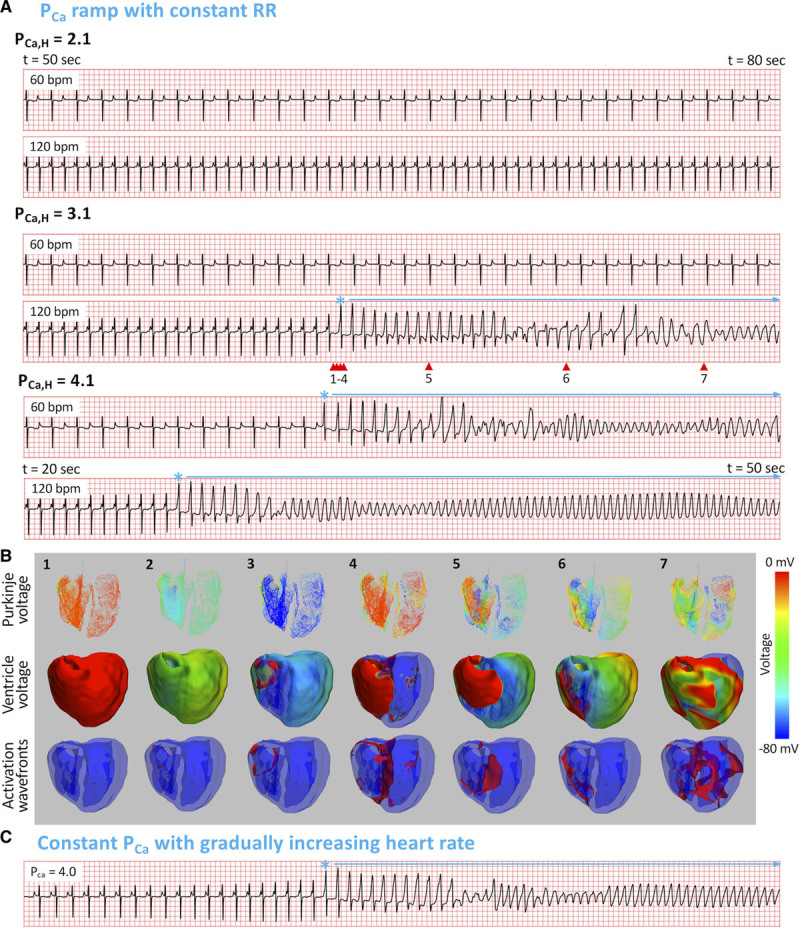
Figure 5.

Spontaneous initiation of arrhythmias in long QT syndrome (LQTS) type 1. A, ECG traces at 2 heart rates (60 and 120 beats per minute) for 3 PCa,H values, using the same PCa ramp protocol in LQTS type 2 (Figure 2A, top). * marks the premature ventricular complexes, and horizontal arrows indicate the polymorphic ventricular tachyarrhythmia (PVT) episodes. B, Numbered snapshots of voltage maps (first and second rows) and wave fronts (colored red, third row) from the time points marked by corresponding red arrows on the fourth ECG in A (120 beats per minute, PCa,H=3.1 µm/s). See Movie V in the Data Supplement for full episode. C, PVT induced by the increasing heart rate protocol. Heart rate was gradually increased from 60 to 120 beats per minute for a constant PCa=4.0 µm/s.
