
Figure 6.
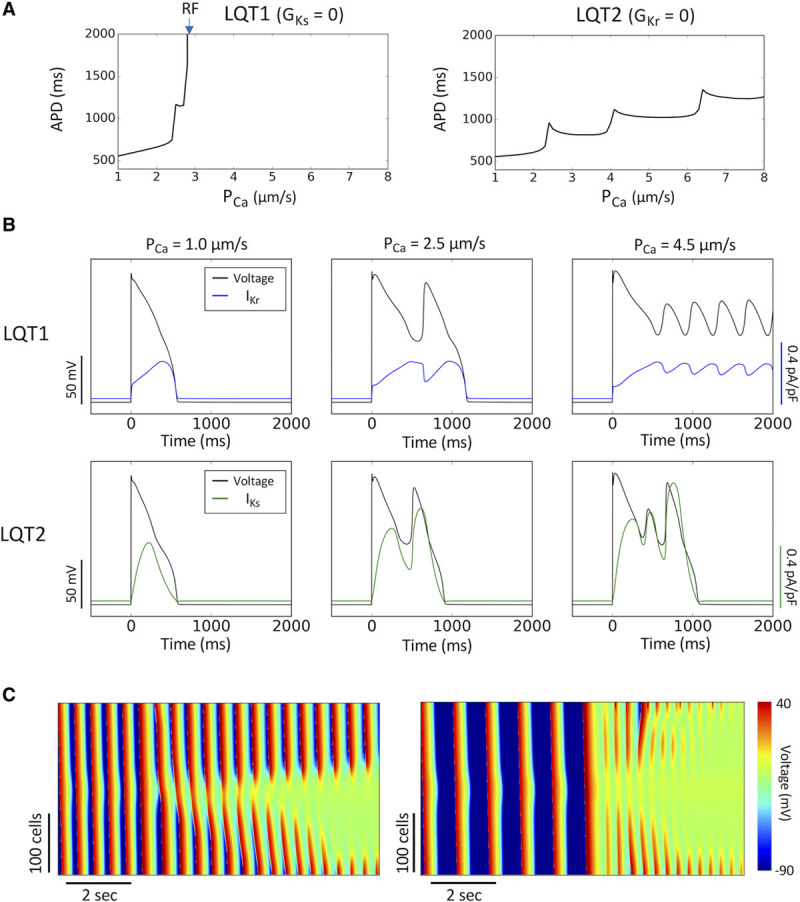
Cellular and tissue mechanisms of arrhythmogenesis in long QT syndrome (LQTS) type 1 (LQT1). A, Single-cell action potential duration (APD) vs PCa for LQT1 (left) and LQTS type 2 (LQT2; right). Arrow marks PCa where repolarization failure (RF) occurs. B, Single-cell voltage, IKr, and IKs vs time for LQT1 (top) and LQT2 (bottom) at 3 PCa values. C, Line scans of voltage in a 1-dimensional cable for PCa=3.1 µm/s at pacing cycle length (PCL)=500 ms (left, corresponding to the fourth ECG in Figure 5A) and PCa=4.1 µm/s at PCL=1000 ms (right, corresponding to the fifth ECG in Figure 5A) in LQT1, showing repolarization failure in the center of the cable generating new premature ventricular complexes.