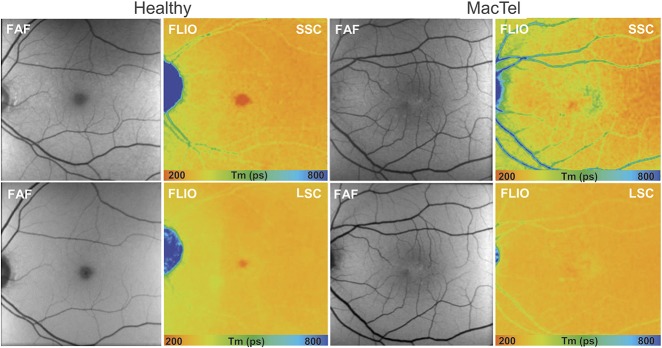
Fig. 1.
Fundus autofluorescence lifetime (color) and intensity (gray) images from the SSC (498–560 nm) and the LSC (560–720 nm) in a healthy subject and a patient with MacTel showing prolongation (blue) of mean fluorescence lifetime temporal to the fovea, with a reduction of short lifetimes (red) within the fovea.

