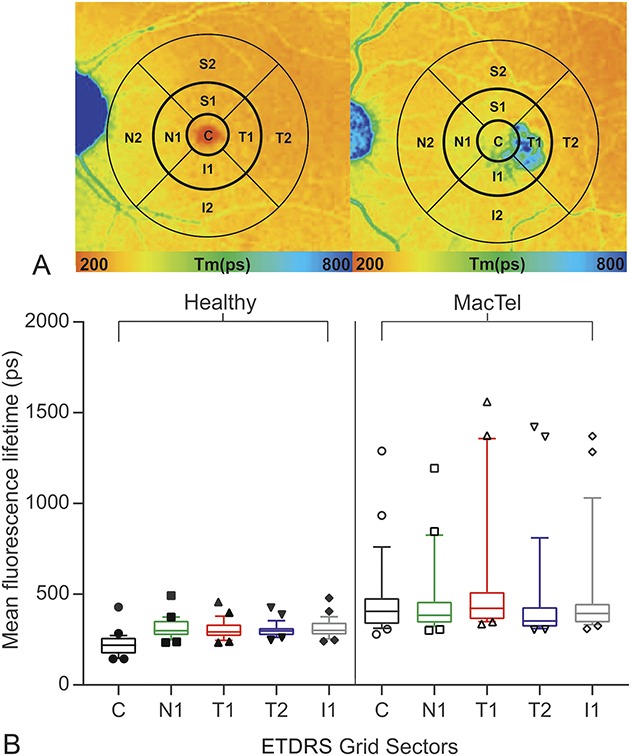
Fig. 2.

A. Control eye from healthy subject and MacTel eye with indicated way of data analysis. A standard ETDRS grid (center [diameter; d = 1 mm], inner [d = 3 mm], and the outer [d = 6 mm] ETDRS ring) was used for data averaging. FLIO SSC = 498 mm to 560 nm, fluorescence lifetime images of the SSC. B. Quantitative analysis of mean retinal autofluorescence lifetime values in the SSC in healthy subjects and MacTel patients. Box plots of mean fluorescence lifetimes (Ƭm) with 10 to 90 percentile of the following areas of the ETDRS grid: central ( ), nasal sector (N1,
  ), temporal sector (T1,
  ), temporal outer sector (T2,
  ), inferior sector (I1,
  ).
).
