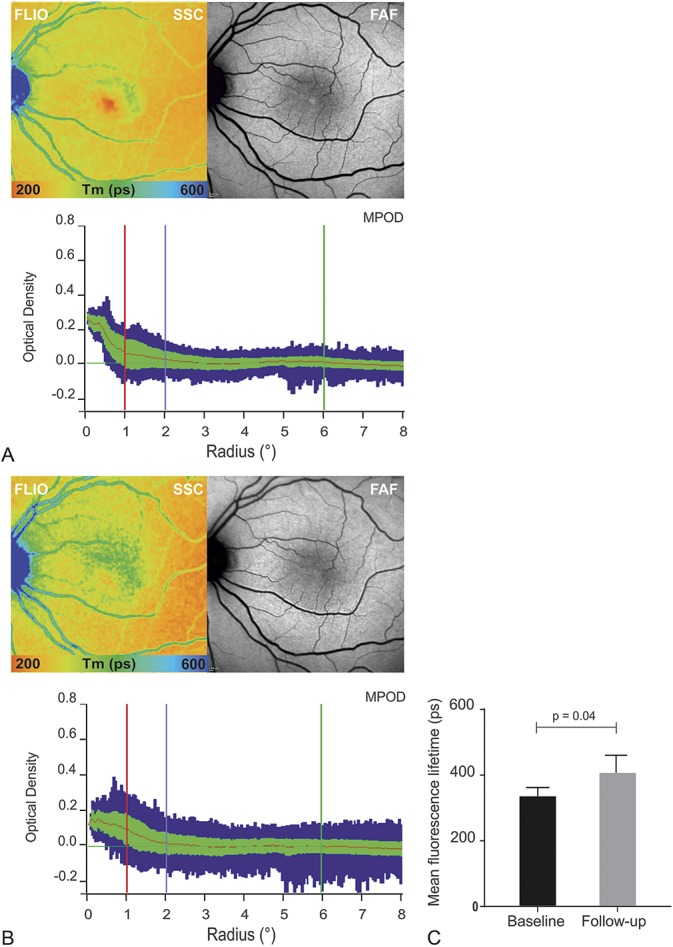
Fig. 6.

A. Disease progression within 24 months FLIO (SSC), fundus AF, and MPOD (baseline, left). Follow-up examination (right) shows clear disease progression with prolongation of temporal lifetimes and a reduction in the macular pigment density. B. Mean fluorescence lifetime of the short spectral of the temporal sector (T1) from the ETDRS grid. Mean and SD of Tm at baseline (left) and follow-up. C. Bar-graph showing progression of mean fluorescence lifetimes from the SSC from baseline to follow-up visit (r2 = 0.2480, P = 0.0409).
