. 2019 Dec 20;8:e46919. doi: 10.7554/eLife.46919

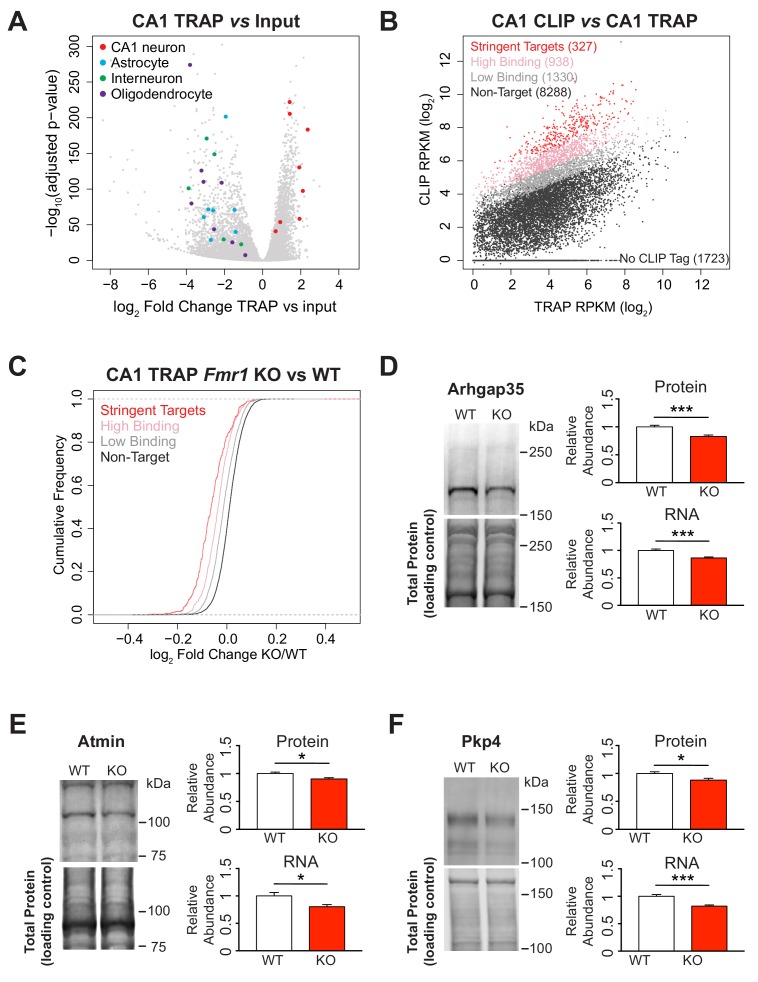
Figure 2. Identification of FMRP targets and CA1 neuron specific TRAP in the Fmr1 KO.

(A) Immunoprecipitation of ribosome associated RNA from CA1 neurons from WT and Fmr1 KO animals. Differential analysis of counts per gene from TRAP RNA compared to input RNA showing fold change and statistical significance as determined by DESeq2. CA1 markers (Wfs1, Pou3f1, Nov, Man1a, Mpped1, Cds1, Fibcd1, Satb2) are enriched in the IP whereas markers for other cell types are depleted (Astrocytes: Slc1a2, Gjb6, Gfap, Slc1a3, Aqp4, Aldoc, Aldh1l1; Interneurons: Slc6a1, Slc32a1, Gad1, Gad2, Pvalb; Oligodendrocytes: Cnp, Mog, Mag, Olig2, Olig1, Mobp, Mbp, Mal). (B) FMRP targets were defined by normalizing CLIP tag density across the coding region to the relative abundance of the transcript as measured by TRAP. A CLIP score per transcript was calculated independently for each replicate of the CLIP experiment. Stringent targets were defined as those with a CLIP score > 2 in every replicate, targets with high binding were defined as those with an average CLIP score > 1 and targets with low binding were defined as those with an average CLIP score between 0 and 1. Scatter plot of average density of CLIP tags across the coding region (CLIP RPKM) vs transcript abundance calculated as TRAP read density across the full transcript (TRAP RPKM). Targets of each subclass are highlighted in the plot and the number of genes within each subclass is indicated. (C) FMRP targets are down-regulated in the Fmr1 KO, with the magnitude of the effect being proportional to the amount of FMRP binding. Cumulative density function plots of the log2 fold change between Fmr1 KO TRAP and WT TRAP for each FMRP target subclass. All subclasses have a significant shift compared to the unbound group (Kolmogorov-Smirnov test, p-value<2.2×10⁻¹⁶ for all pairwise comparisons) and there are also significant differences between each subclass (stringent binding vs high binding: p-value=5.78×10⁻⁹; high binding vs low binding: p-value<2.2×10⁻¹⁶). (D–F) Quantitative western blot and PCR validation of TRAP results. Protein and RNA levels of the FMRP targets Arhgap35 (D), Atmin (E) and Pkp4 (F) are decreased in hippocampal lysates from Fmr1 KO mice relative to WT. A representative western blot is shown for one pair of WT and KO littermates. Western blots were normalized to total protein per lane visualized with REVERT total protein stain. qPCR data was normalized to Gapdh, Actin and Hprt housekeeping genes. Data are from 6 to 9 animals per genotype and mean ± SEM is shown. p-values were calculated using Student’s t-test (*p<0.05, ***p<0.001).

Figure 2.

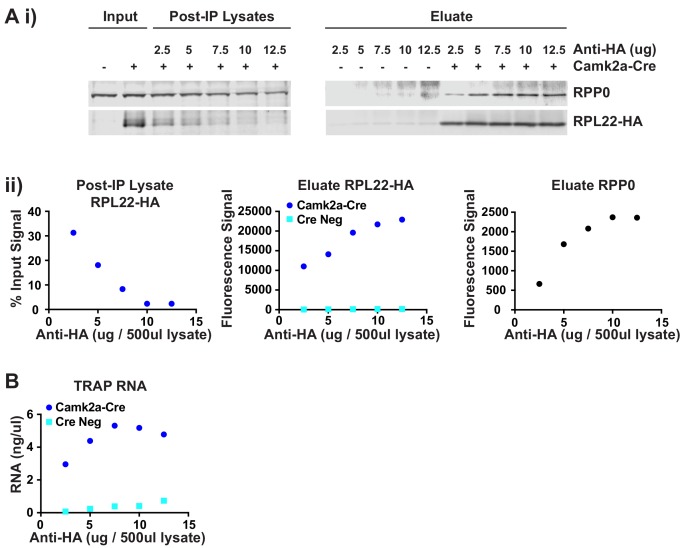
Figure 2—figure supplement 1. Optimization of TRAP immunoprecipitation.

Figure 2—figure supplement 1.

The amount of antibody required for the TRAP IP was determined by titration. 500 μl hippocampal lysate was incubated with varying amounts of anti-HA antibody from 2.5 to 12.5 μg, followed by pull down of the antibody-ribosome-mRNA complex with protein A dynabeads. After washing, half the beads were used for protein extraction while the other half were used RNA isolation. (A) Protein concentration in the input lysate and remaining in the supernatant after IP (Post-IP Lysate) as well as the amount of protein eluted from the beads was determined by Western blotting. Western blots for the ribosomal protein RPP0 and the HA-tagged RPL22 ribosomal protein are shown (i) along with the quantification of the protein bands (ii). (B) Concentration of RNA eluted from the beads is shown for each IP. Based on these combined results 10 μg antibody per 500 μl lysate was determined to be the optimal concentration to ensure maximal depletion of the HA-tagged polysomes and give the best signal-to-noise.
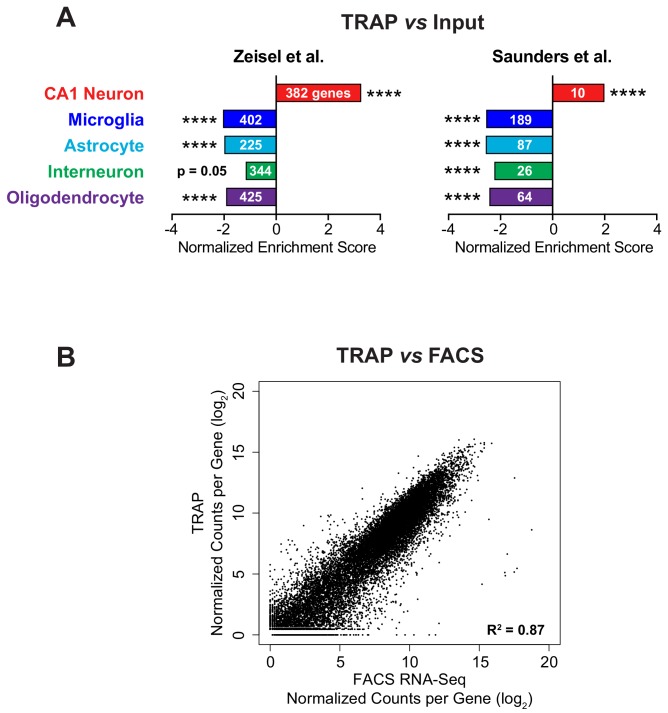
Figure 2—figure supplement 2. Validation of TRAP method.

Figure 2—figure supplement 2.

(A) Enrichment and depletion of relevant cell type markers in the immunoprecipitated TRAP mRNA compared to the input mRNA was confirmed using Gene Set Enrichment Analysis (GSEA). Cell type specific markers were determined from available mouse brain single-cell RNA-Seq data (Saunders et al., 2018; Zeisel et al., 2015). The normalized enrichment score from GSEA is plotted, indicating the enrichment or depletion of the cell type markers in TRAP vs input RNA-Seq. The FDR value (estimated probability that the normalized enrichment score represents a false positive finding) is shown along with the number of genes in each gene set (**** FDR < 0.0001). (B) TRAP is comparable to RNA-Seq from FACS-isolated CA1 pyramidal neurons indicating good isolation of the entire transcriptome by TRAP. The same Camk2a-Cre mouse line was crossed with either the conditional RiboTag (TRAP) or tdTomato (FACS) mouse line. RNA-Seq from TRAP was compared with RNA-Seq from sorted tdTomato-positive cells. Normalized counts per gene from three biological replicates of both experiments are well correlated (Pearson correlation, R2 = 0.87).
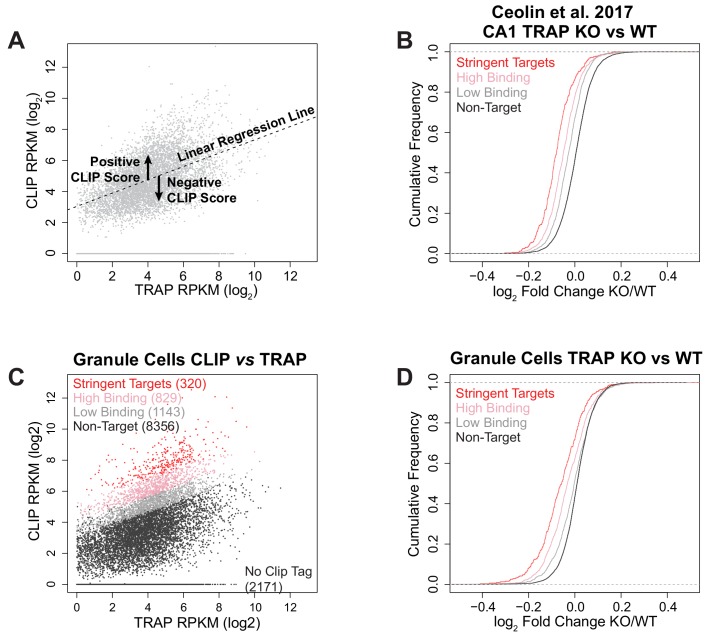
Figure 2—figure supplement 3. Identification of FMRP targets and comparison with other published data and cell types.

Figure 2—figure supplement 3.

(A) Illustration of the CLIP score metric. For each biological replicate of CLIP, the density of CLIP tags across the coding region (log2 CLIP RPKM) of each transcript was plotted against the transcript abundance as determined by TRAP from the same cell type (log2 TRAP RPKM). A linear regression line was fitted to the data and for each transcript the vertical deviation from this line was calculated as CLIP score = [log2 CLIP RPKM – (slope of fitted line x log2 TRAP RPKM) + intercept of fitted line]. Thus, a positive CLIP score indicates a higher representation of the transcript in the CLIP data than expected for a transcript of that abundance and preferential binding of FMRP to the transcript. (B) Reanalysis of CA1 TRAP data from Fmr1 KO RiboTagWfs1-CreERT2 adult mice following tamoxifen induction published in Ceolin et al. (2017): Cumulative density function plots of the log2 fold change between Fmr1 KO TRAP and WT TRAP for each FMRP target subclass. Equivalent to Figure 2C. The results are the same as seen in our own data with FMRP targets being down-regulated in the Fmr1 KO relative to the amount of FMRP binding. (C) FMRP targets were defined for cerebellar granule cells in the same way as for CA1 neurons. Stringent targets are those with a CLIP score > 2 in every replicate, targets with high binding are those with an average CLIP score > 1 and targets with low binding are those with an average CLIP score between 0 and 1. Scatter plot of average density of CLIP reads across the coding region (CLIP RPKM) vs transcript abundance calculated as TRAP read density across the full transcript (TRAP RPKM). Targets of each subclass are highlighted in the plot and the number of genes within each subclass is indicated. Equivalent to CA1 data plotted in Figure 2B. (D) FMRP targets are also down-regulated in cerebellar granule cells similar to the effect seen in CA1 neurons. Cumulative density function plots of the log2 fold change between Fmr1 KO TRAP and WT TRAP for each FMRP target subclass in cerebellar granule cells. Equivalent to CA1 data plotted in Figure 2C.
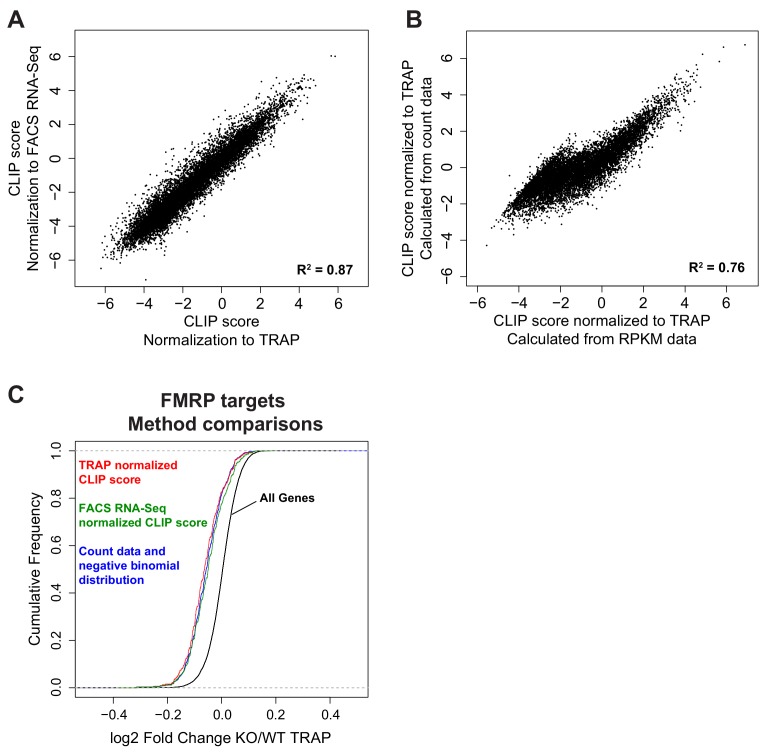
Figure 2—figure supplement 4. Comparison of different CLIP score methods.

Figure 2—figure supplement 4.

(A) CLIP score was determined either by normalization to mean TRAP RPKM per transcript or by normalization to mean FACS RNA-Seq RPKM per transcript. CLIP scores calculated with both methods were highly comparable (Pearson correlation, R2 = 0.87). (B) CLIP score was determined either by a linear regression method comparing CLIP RPKM per CDS to mean TRAP RPKM per transcript or a linear regression method comparing normalized CLIP and TRAP counts per CDS. CLIP scores calculated with both methods were highly comparable (Pearson correlation, R2 = 0.76). (C) Decrease in expression of FMRP targets in Fmr1 KO CA1 neurons is conserved across FMRP target lists generated by all analysis methods suggesting all methods are equally successful at selecting functionally relevant FMRP targets. Three methods were compared: 1) Linear model of CLIP CDS RPKM vs TRAP transcript RPKM and CLIP score determined from deviation from the fitted model (stringent targets defined as CLIP score > 2 in all three replicates), 2) Linear model of CLIP CDS RPKM vs FACS RNA-Seq transcript RPKM and CLIP score determined from deviation from the fitted model (stringent targets defined as CLIP score > 2 in all three replicates), 3) Linear model of CLIP CDS counts vs TRAP CDS counts incorporating a dispersion estimate and using a negative binomial distribution to determine significance (stringent targets defined as adjusted p-value<0.05). Number of stringent FMRP targets defined by each method was 327, 363, 441, respectively.