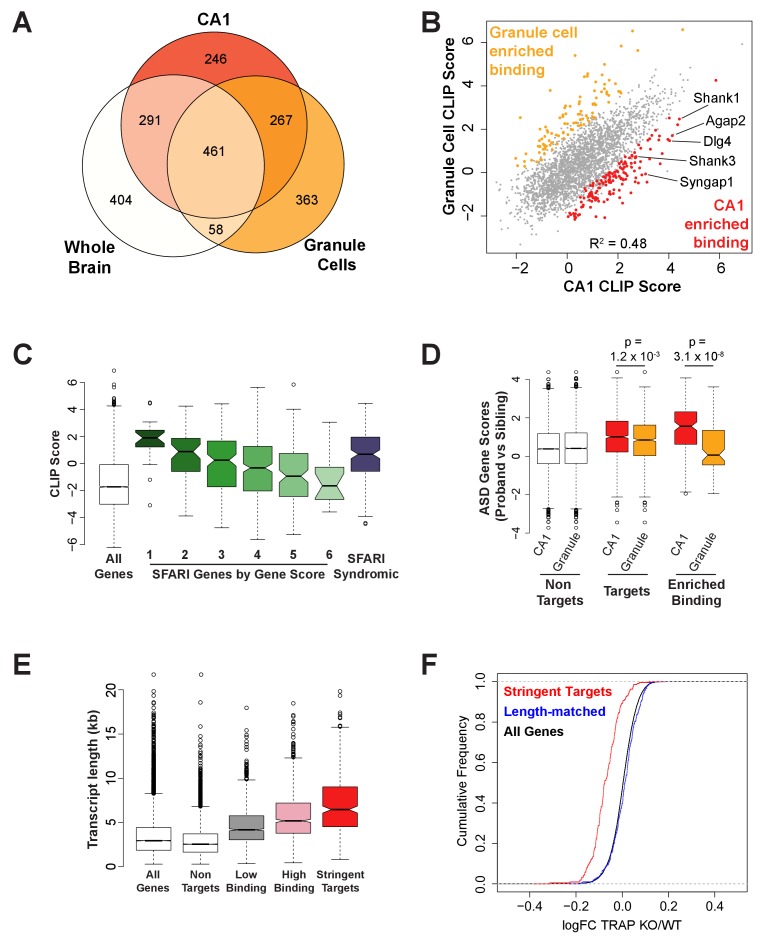
Figure 3. FMRP binds autism-related mRNAs and long transcripts.
(A) Venn Diagram comparing FMRP targets in CA1 neurons to those determined from whole brain FMRP CLIP and cerebellar granule cell CLIP. Targets were defined as CLIP score >1 for CA1 and granule cells or as false discovery rate (FDR) < 0.05 and detection in at least 6 of 10 experiments for whole brain. (B) Scatter plot of FMRP CLIP score in CA1 neurons compared to FMRP CLIP score in cerebellar granule cells. Transcripts with significantly enriched binding in CA1 (p<0.05) are indicated in red. CA1-enriched targets relevant to Fragile X phenotypes are highlighted. (C) FMRP is highly associated with autism-related transcripts in CA1. SFARI genes associated with Autism Spectrum Disorders, were grouped according to their gene score where a lower gene score indicates a higher strength of the evidence linking candidate genes to ASD. Category 1: High confidence, Category 2: Strong candidate, Category 3: Suggestive evidence, Category 4: Minimal evidence, Category 5: Hypothesized but untested, Category 6: Evidence does not support a role, Syndromic: Genes predisposing to autism in the context of a syndromic disorder. Box and whisker plot of CLIP scores for genes in each class shows greatest association of FMRP with the highest confidence ASD gene candidates. Wilcoxon rank sum test for SFARI gene CLIP scores compared to CLIP scores for all CA1 expressed genes: SFARI category 1, p=8.1×10⁻¹¹, n = 25; SFARI category 2, p=5.2×10⁻¹³, n = 61, SFARI category 3, p=2.3×10⁻¹⁶, n = 184; SFARI category 4, p<2.2×10⁻¹⁶, n = 437; SFARI category 5, p=3.5×10⁻⁴, n = 170; SFARI category 6, p=0.71, n = 24; SFARI Syndromic, p<2.2×10⁻¹⁶, n = 166. (D) FMRP binding to ASD-related transcripts is enriched in CA1 neurons relative to cerebellar granule cells. ASD gene scores were determined by Network-neighborhood Differential Enrichment Analysis of de novo mutations in ASD proband versus unaffected sibling (Zhou et al., 2019) such that genes with higher gene scores are part of a network or pathway predicted to have a significant disease impact. ASD gene scores were compared across FMRP non-targets and targets determined by CA1 and granule cell CLIP. Targets were defined as CLIP score >1. ASD gene scores were also compared between transcripts with enriched binding in either CA1 neurons or cerebellar granule cells. Only transcripts expressed in both cell types were included in the analysis. p-values were calculated by Wilcoxon rank sum test. (E) FMRP preferentially associates with long transcripts. FMRP targets of all classes consist of transcripts of significantly longer than average length with the effect being greatest for the most stringent targets. Stringent targets were defined as those with a CLIP score >2 in every replicate, targets with high binding were defined as those with an average CLIP score >1, targets with low binding were defined as those with an average CLIP score between 0 and 1 and non-targets were all transcripts with a CLIP score <0. All classes of FMRP targets were significantly longer than the full transcriptome (p-value<2.2×10⁻¹⁶ for all pairwise comparisons, Wilcoxon rank sum test). (F) FMRP regulates a specific subset of long transcripts. A set of FMRP stringent targets (CLIP score > 2 in every replicate) and non-targets (CLIP score < 1) were selected that had the same distribution of transcript lengths and TRAP RPKM in the range 10–200. Cumulative density function plots of the log2 fold change between Fmr1 KO TRAP and WT TRAP for these subsets show specific regulation of the bound transcripts. Kolmogorov-Smirnov test: stringent targets vs length-matched non-targets, p-value<2.2×10⁻¹⁶.


