. 2019 Dec 20;8:e46919. doi: 10.7554/eLife.46919

Figure 4. FMRP targets genes involved in neuronal function and circadian rhythm in CA1 neurons.

(A) Selected results from gene ontology analysis of CA1 transcriptome ranked by FMRP binding (CLIP Score) or negative log fold change Fmr1 KO vs WT TRAP. (B) Selected results from gene set enrichment analysis (GSEA) of the same ranked data sets. Heatmap represents normalized enrichment score (NES) with FDR values indicated (* FDR < 0.05; ** FDR < 0.01, *** FDR < 0.001, **** FDR < 0.0001, n.s. not significant). The NES reflects the degree to which a gene set is overrepresented at the top or bottom of a ranked list of genes normalized for differences in gene set sizes. (C) Heatmaps of CLIP score and log2 fold change Fmr1 KO vs WT TRAP for transcripts in the ‘BMAL1 CLOCK NPAS2 activation of circadian expression’ gene set from the Reactome database (Fabregat et al., 2018). (D) Circadian genes encode transcripts that are specifically bound and regulated by FMRP in CA1 neurons. Distribution of CLIP score (i, iii) and log2 fold change Fmr1 KO vs WT TRAP (ii, iv) for circadian genes in the ‘BMAL1 CLOCK NPAS2 activation of circadian expression’ Reactome gene set are shown relative to a set of randomly selected genes from the relevant transcriptome matched both for the number of genes represented and transcript length (Matched Group). Data are show for CA1 neurons (i, ii) and cerebellar granule cells (iii, iv). P-values were calculated using the Wilcoxon rank sum test (**p<0.01, ****p<0.0001, n.s. not significant).

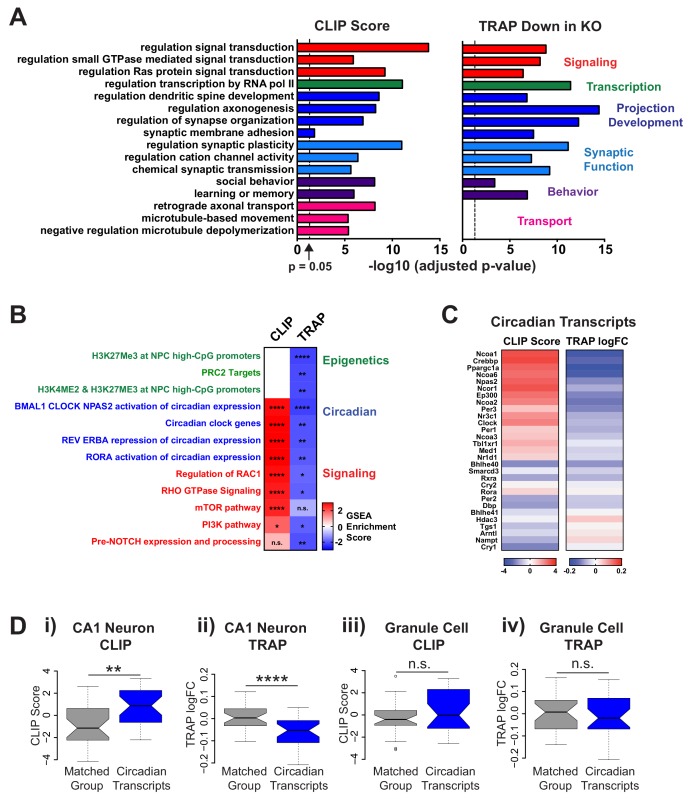
Figure 4.

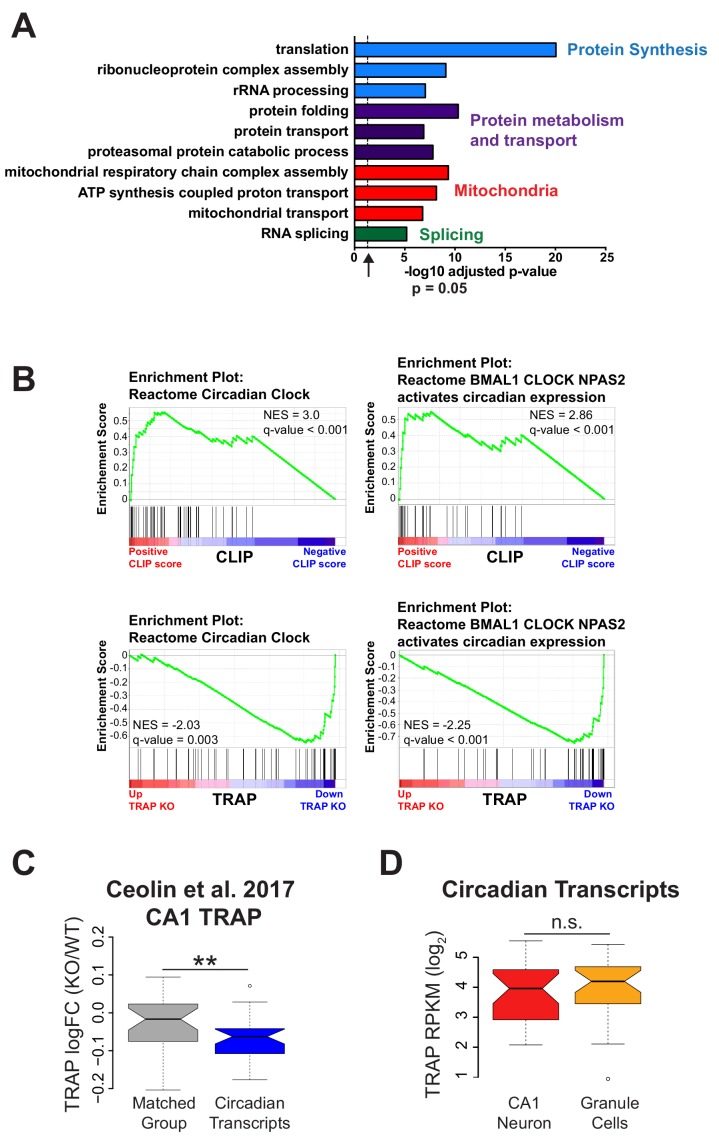
Figure 4—figure supplement 1. Genes related to protein synthesis and metabolism and mitochondrial function are up-regulated and circadian genes are down-regulated in Fmr1 KO CA1 neurons.

Figure 4—figure supplement 1.

(A) Selected results from gene ontology analysis of up-regulated genes in Fmr1 KO vs WT TRAP showing up-regulation of genes involved in protein synthesis and metabolism, mitochondrial function and RNA splicing. (B) GSEA enrichment plots related to Figure 4B showing that genes in the ‘Circadian Clock’ and the ‘BMAL1 CLOCK NPAS2 activates circadian expression’ gene sets from the Reactome database are enriched for FMRP binding and down-regulated in the Fmr1 KO. Normalized enrichment score (NES) reflects the degree to which a gene set is overrepresented at the top or bottom of a ranked list of genes normalized for differences in gene set sizes and the q-value (false discovery rate) is the estimated probability that a gene set with a given NES represents a false positive finding. Black lines represent the position within the ranked list of each gene in the gene set. (C) Reanalysis of data published in Ceolin et al. (2017): distribution of log2 fold change Fmr1 KO vs WT TRAP. Circadian genes in the ‘BMAL1 CLOCK NPAS2 activation of circadian expression’ gene set from the Reactome database are shown relative to a set of randomly selected genes matched both for the number of genes represented and transcript length (Matched Group). Equivalent to Figure 4D(ii). The results are the same as seen in our own data with circadian genes down-regulated in the Fmr1 KO CA1 neurons. P-value calculated using Wilcoxon rank sum test (p=0.0087). (D) Expression of circadian genes is similar in CA1 neurons and cerebellar granule cells. Expression of circadian genes in the ‘BMAL1 CLOCK NPAS2 activation of circadian expression’ Reactome gene set was calculated from TRAP data in CA1 neurons and cerebellar granule cells from WT animals. One gene, Npas2, is expressed only in CA1 neurons and was removed from the analysis. P-value was calculated using the Wilcoxon rank sum test (p=0.4393, not significant (n.s.)).
Figure 4—figure supplement 2. Circadian-relevant FMRP targets are down-regulated by quantitative PCR in Fmr1 KO mouse hippocampus.

Figure 4—figure supplement 2.

RNA levels of the FMRP targets Ppargc1a, Npas2 and Ncoa2 are decreased in hippocampal tissue from Fmr1 KO mice relative to WT confirming TRAP results. Data is from 8 WT mice and 9 Fmr1 KO littermates. Data was normalized to Gapdh, Actin and Hprt housekeeping genes. Mean ± SEM is shown. p-values calculated using Student’s t-test (*p<0.05, ***p<0.001).
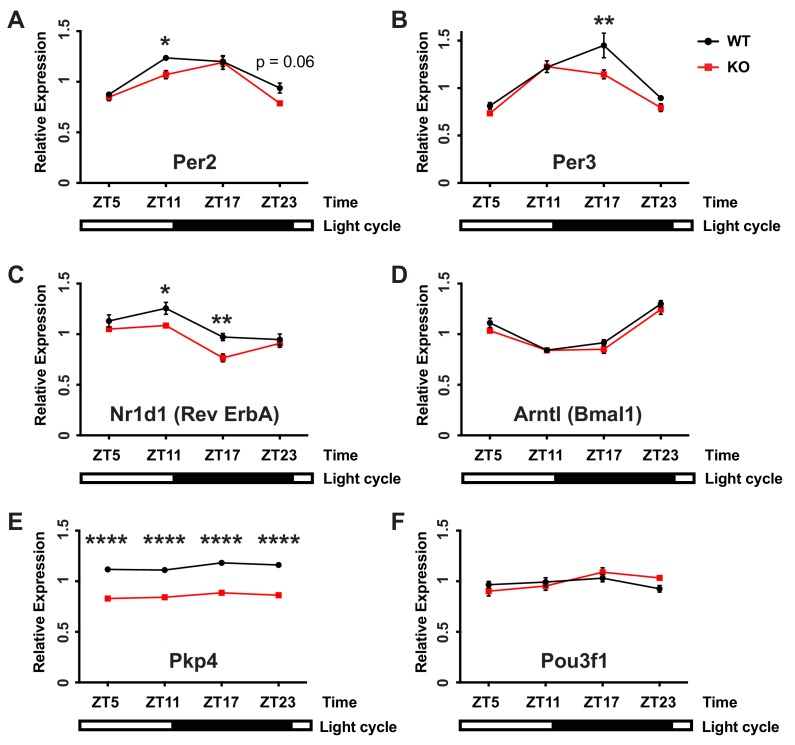
Figure 4—figure supplement 3. Loss of FMRP disrupts CA1 circadian oscillations in gene expression.

Figure 4—figure supplement 3.

Fmr1 KO mice and WT littermates were euthanized at different times across the circadian cycle. Quantitative PCR was used to determine RNA abundance from CA1 tissue for four circadian transcripts that oscillate within hippocampus (A-D), a non-circadian FMRP target (E) and a non-circadian CA1 transcript that is not regulated by FMRP (F). Mean ± SEM is shown. Data was analyzed by two-way ANOVA (genotype x time) followed by post hoc Bonferroni’s multiple comparison test to compare genotypes at individual time points (*p<0.05, **p<0.01, ****p<0.0001)].