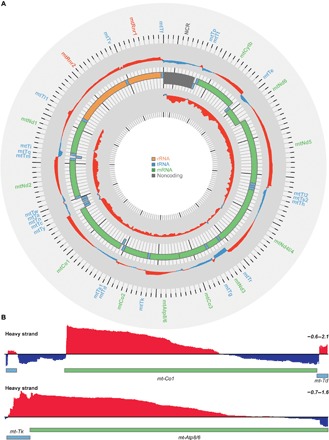
Fig. 2. Transcriptome analysis of mitochondrial transcripts by RNA-Seq.

(A) Complete map of changes in mitochondrial transcript abundance determined by RNA-Seq coverage from control (L/L) and knockout (L/L, cre) mice on heavy (outer track) and light (inner track) strands. Increases are shown in red, and decreases are shown in blue (log2[RPMKO/RPMWT]; scale, −1.0 to 2.0). The mitochondrial genome is displayed in the central track, with the nucleotide position in base pairs displayed across the exterior; rRNAs are displayed in orange, mRNAs are in green, tRNAs are in blue, and the noncoding region (NCR) is in gray. (B) Genome browser view of the mean RNA-Seq coverage (log2[RPMKO/RPMWT] of Co1 and Atp8/6 mRNAs (scale, −0.6 to 2.1).
