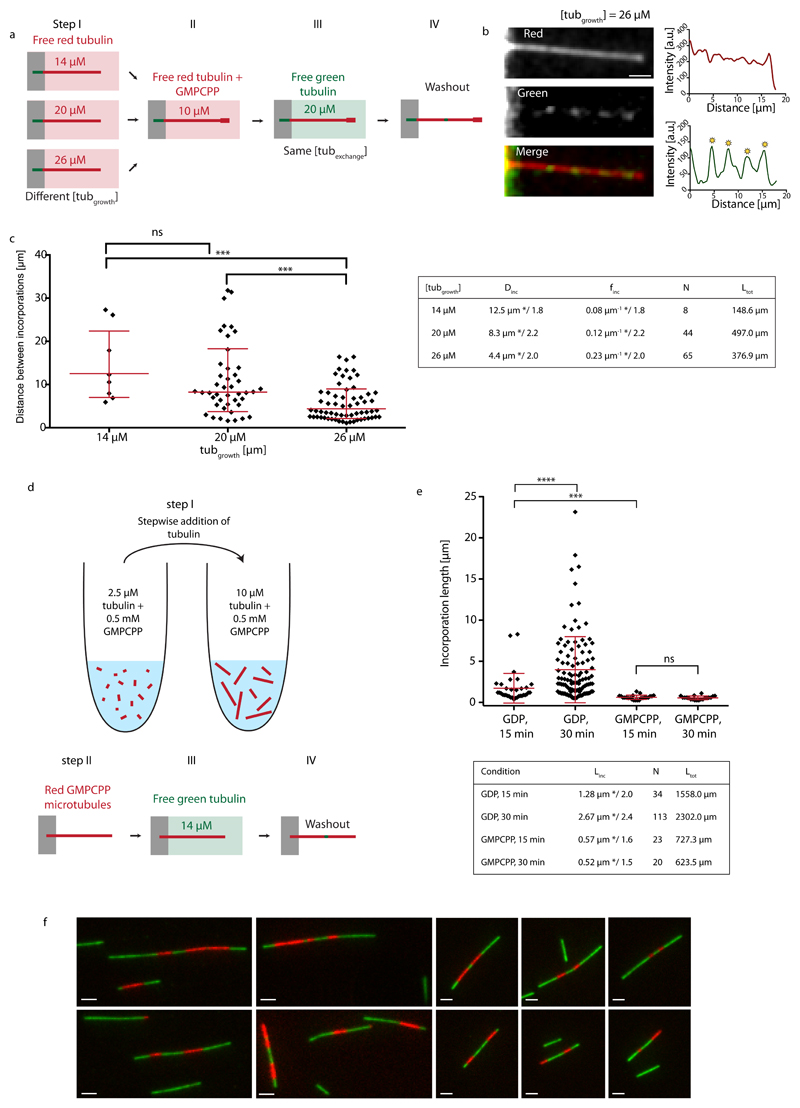
Figure 4.
Incorporation of free tubulin into the microtubule lattice visualized by TIRF. (a) Schematic representation of the experimental setup to test the role of the microtubule growth rate (i.e. lattice-defect frequency) on tubulin turnover in the microtubule lattice. Microtubules were grown in 14 μM, 20 μM or 26 μM red-fluorescent free tubulin (step I) before capping with GMPCPP (step II). Microtubules were then exposed to 20 μM green-fluorescent free tubulin for 15 min (step III) before washout and imaging (step IV). (b) The images and line scans (red curve: red fluorescent channel, green curve: green fluorescent channel) show an example of a microtubule grown at a free tubulin concentration of 26 μM, which contains several incorporation spots marked by the yellow asterisks. Scale bar: 3 μm. (c) The graph shows the distribution of distances between incorporation sites after concatenating all microtubules in a random order. Red bars represent the geometric mean*/sd factor. p-values are <0.001 for the concentration pairs (20 μM, 26 μM) and (14 μM, 26 μM). The table summarizes the mean distance (Dinc) and frequency (finc) between incorporation spots (geometric mean */sd factor). N and Ltot denote the total number of observed incorporation spots and the total length of microtubules analyzed, respectively. (d,e) Incorporation of free tubulin into GMPCPP-microtubules. (d) Schematic representation of the experimental setup used to test microtubule lattice turnover in GMPCPP-microtubules. Red labeled GMPCCP microtubules were first polymerized in a test tube by the step-wise addition of GMPCPP-tubulin (step I), before being transferred and fixed to the bottom of a passivated microfluidic chamber (step II). GMPCPP-microtubules were then exposed to green labeled free tubulin for 15 or 30 min (step III). Prior to imaging, the free tubulin was washed out (step IV). (e) The graph shows the distributions of the length of tubulin incorporation spots (Linc) into the GMPCPP-lattice (and the GDP-lattice for comparison, see Fig. 1d) after 15 and 30 min of incubation at 14 μM free tubulin. The red bars indicate the geometric mean*/sd factor, which are also summarized in the table (N and Ltot denote the total number of observed incorporation spots and the total length of microtubules analyzed, respectively.). (f) Alternating patterns of red and green labeled tubulin along GMPCPP-microtubules which indicate annealing. In a separate experiment from the scheme indicated in (d), to show microtubule annealing, microtubules were first polymerized in a test tube from red labeled GMPCPP-tubulin and then elongated with green GMPCPP-tubulin. The simple pattern green-red-green shows the initial red tubulin stretch, which was elongated at the (+)- and (-)-ends by green tubulin. The alternating pattern green-red-green-red-green indicates annealing between two microtubules.

