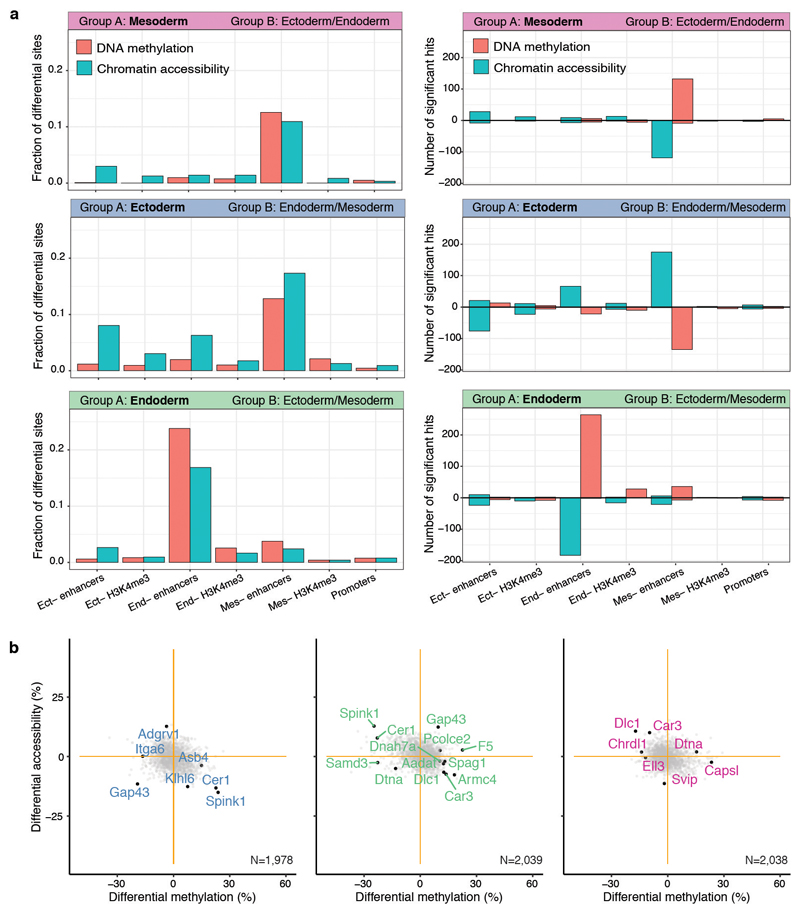
Extended Data Fig. 6. Differential DNA methylation and chromatin accessibility analysis at E7.5 for different genomic contexts.
a, Bar plots showing the fraction (left) or the total number (right) of differentially methylated (red) or accessible (blue) loci (FDR<10%, y-axis) per genomic context (x-axis). Each subplot corresponds to the comparison of one cell type (group A) against cells comprising the other cell types present at E7.5 (Group B). For the right panel, positive values indicate an increase in DNA methylation or chromatin accessibility in group A, whereas negative values indicate a decrease in DNA methylation or chromatin accessibility. Differential analysis of DNA methylation and chromatin accessibility was performed independently for each genomic element using a two-sided Fisher exact test of equal proportions (Methods). b, Scatter plots showing differential DNA methylation (x-axis) versus chromatin accessibility (y-axis) analysis at promoters. Shown are ectoderm vs non-ectoderm cells (left), endoderm vs non-endoderm cells (middle) and mesoderm vs non-mesoderm cells (right). Each dot corresponds to a gene. Labeled black dots highlight genes with lineage-specific RNA expression that show significant differential methylation or accessibility in their promoter (FDR<10%).

