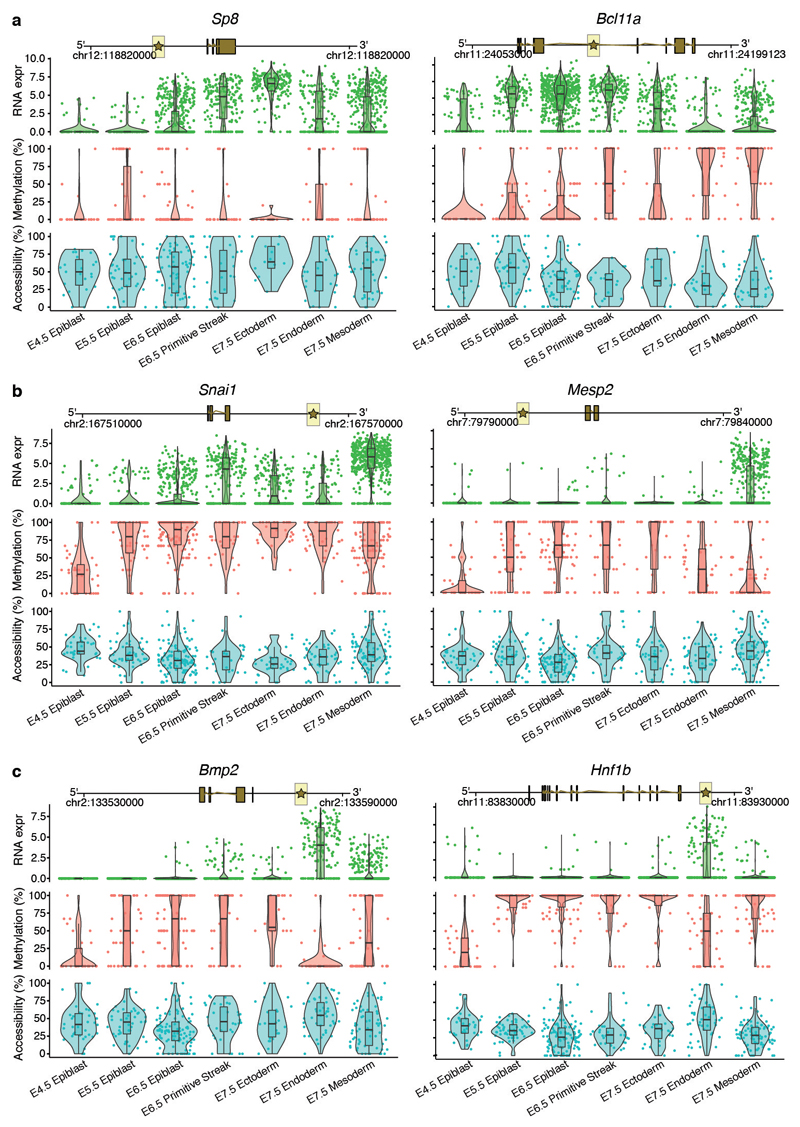
Extended Data Fig. 7. Illustrative examples of putative epigenetic regulation in enhancer elements during germ layer commitment.
Box and violin plots showing the distribution of RNA expression (log2 counts, green), and enhancer DNA methylation (%, red) and chromatin accessibility (%, blue) levels for key germ layer markers per stage and cell type. Shown are marker genes for a, ectoderm, b, mesoderm, and c, endoderm. Box plots show median levels and the first and third quartile, whiskers show 1.5x the interquartile range. Each dot corresponds to a single cell. For each gene a genomic track is shown on the top. The enhancer region that is used to quantify DNA methylation and chromatin accessibility levels is represented with a star and highlighted in yellow. Genes were linked to putative enhancers by overlapping genomic coordinates with a maximum distance of 50kb.

