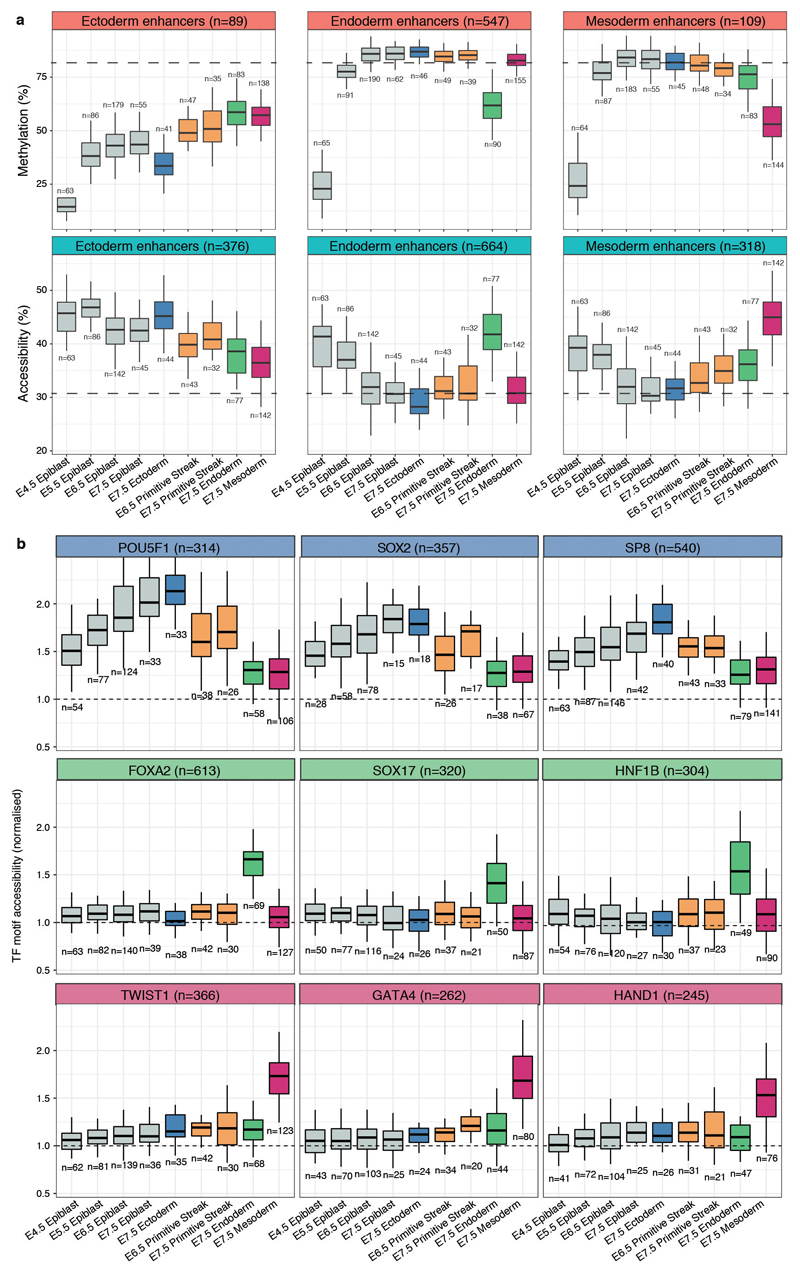
Extended Data Fig. 9. DNA methylation and chromatin accessibility dynamics of E7.5 lineage-specific enhancers and transcription factor motifs across development.
a, Box plots showing the distribution of DNA methylation (top) or chromatin accessibility (bottom) levels of E7.5 lineage-defining enhancers, across stages and cell types. Box plots show median levels and the first and third quartile, whiskers show 1.5x the interquartile range. The dashed lines represent the global background levels of DNA methylation at E7.5 (see Extended Data Fig. 3). b, Box plots showing the distribution of chromatin accessibility levels (scaled to the genome-wide background) for 200bp windows around transcription factor motifs associated with commitment to ectoderm (top), endoderm (middle) and mesoderm (bottom). Box plots show median levels and the first and third quartile, whiskers show 1.5x the interquartile range.

