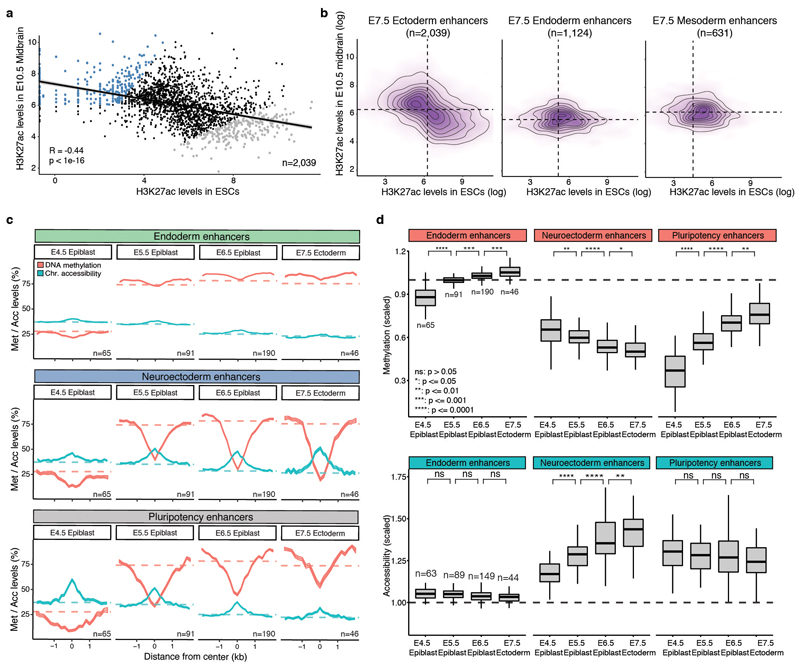
Extended Data Fig. 10. E7.5 ectoderm enhancers contain a mixture of pluripotency and neural signatures with different epigenetic dynamics.
a, Scatter plot showing H3K27ac levels for individual ectoderm enhancers (n=2039) quantified in serum ESCs (pluripotency enhancers, x-axis) versus E10.5 midbrain (neuroectoderm enhancers, y-axis). H3K27ac levels in the two lineages are negatively correlated (Pearson’s R = −0.44), indicating that most enhancers are either marked in ESCs or in the brain. Highlighted are the top 250 enhancers that show the strongest differential H3K27ac levels between midbrain and ESCs (blue for midbrain-specific enhancers and grey for ESC-specific enhancers). b, Density plots of H3K27ac levels in ESCs versus E10.5 midbrain. H3K27ac levels are negatively correlated at E7.5 ectoderm enhancers, but not in E7.5 endoderm (n=1124) or mesoderm enhancers (n=631). c, Profiles of DNA methylation (red) and chromatin accessibility (blue) along the epiblast-ectoderm trajectory. Panels show different genomic contexts: E7.5 ectoderm enhancers that are specifically marked by H3K27ac in the midbrain (middle) or ESCs (bottom) (highlighted populations in a). Shown are running averages of 50bp windows around the center of the ChIP-seq peaks (2kb upstream and downstream). Solid lines display the mean across cells (within a given lineage) and shading displays the standard deviation. Dashed horizontal lines represent genome-wide background levels for DNA methylation (red) and chromatin accessibility (blue). For comparison, we have also incorporated E7.5 endoderm enhancers (top), which follow the genome-wide repressive dynamics. d, Box plots of the distribution of DNA methylation (top) and chromatin accessibility (bottom) levels along the epiblast-ectoderm trajectory. Panels show different genomic contexts: E7.5 ectoderm enhancers that are specifically marked by H3K27ac in the midbrain (middle) or ESCs (right) (highlighted populations a). Box plots show median levels and the first and third quartile, whiskers show 1.5x the interquartile range. Dashed lines denote background DNA methylation and chromatin accessibility levels at the corresponding stage and lineage. For comparison, we have also incorporated E7.5 endoderm enhancers (left), which follow the genome-wide repressive dynamics.

