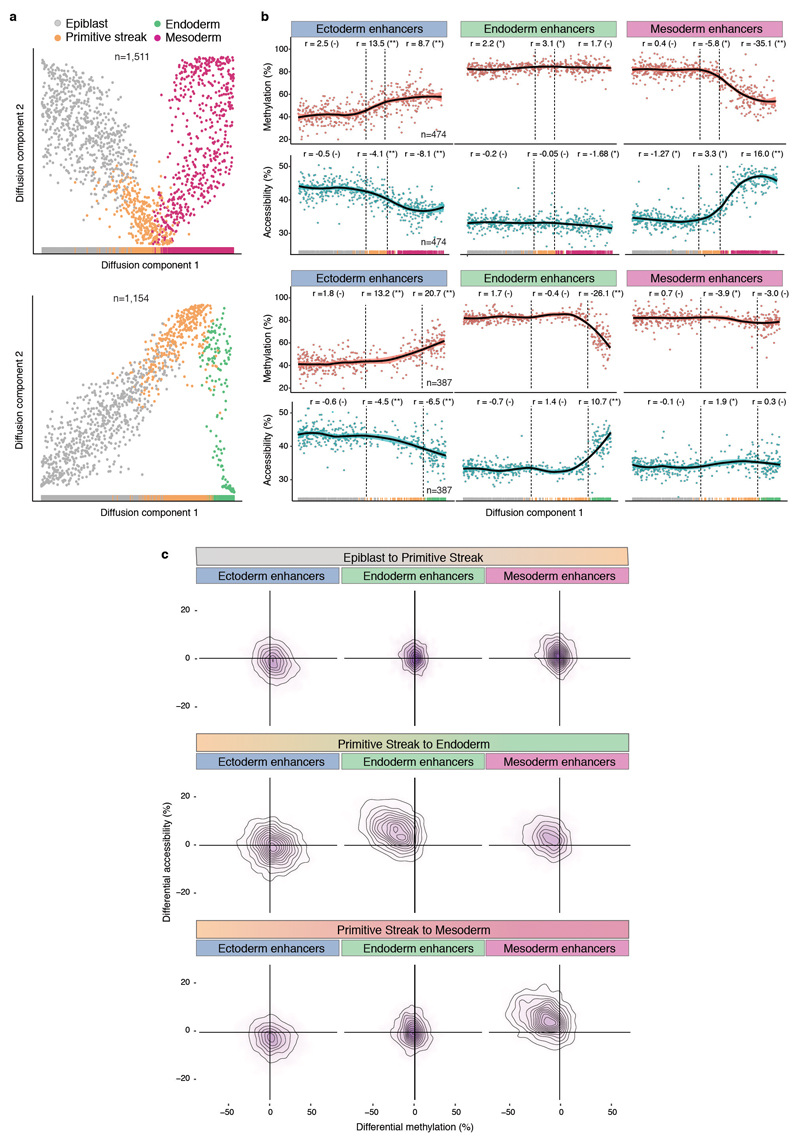
Extended Data Fig. 11. Silencing of ectoderm enhancers precedes activation of mesoderm and endoderm enhancers.
a, Reconstructed mesoderm (top) and endoderm (bottom) commitment trajectories using a diffusion pseudotime method applied to the RNA expression data (Methods). Shown are scatter plots of the first two diffusion components, with cells coloured according to their lineage assignment (n=1,154 for endoderm and n=1,511 for mesoderm). For both cases, ranks along the first diffusion component are selected to order cells according to their differentiation state. b, DNA methylation (red) and chromatin accessibility (blue) dynamics of lineage-defining enhancers along the mesoderm (top) and endoderm (bottom) trajectories. Each dot denotes a single cell (n=387 for endoderm and n=474 for mesoderm) and black curves represent non-parametric loess regression estimates. In addition, for each scenario we fit a piece-wise linear regression model for epiblast, primitive streak and mesoderm or endoderm cells (vertical lines indicate the discretised lineage transitions). For each model fit, the slope (r) and its significance level is displayed in the top (- for non-significant, * for 0.01<p<0.1 and ** for p<0.01). c, Density plots showing differential DNA methylation (%, x-axis) and chromatin accessibility (%, y-axis) at lineage-defining enhancers calculated for each of the lineage transitions.

