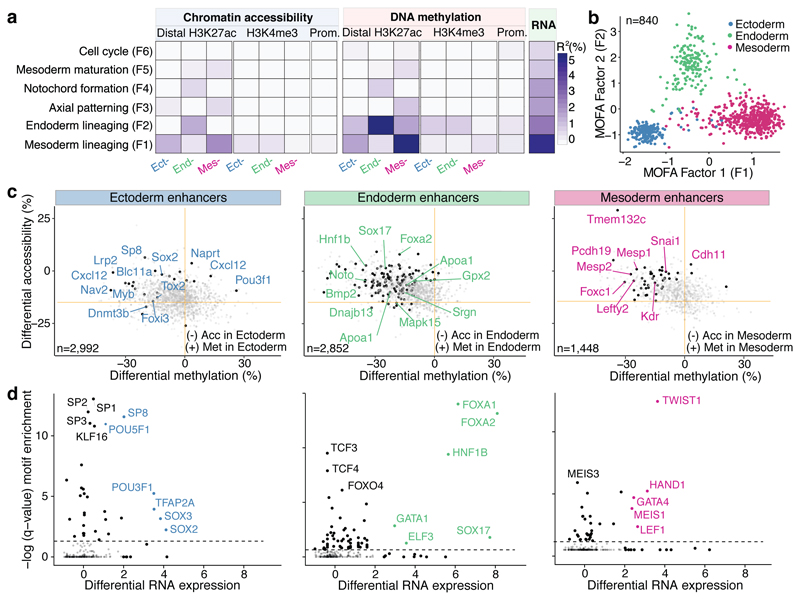
Fig. 2. Multi-omics Factor Analysis reveals coordinated epigenetic and transcriptomic variation at enhancer elements during germ layer commitment.
a, Percentage of variance explained (R2) by each MOFA factor (rows) across data modalities (columns). b, Scatter plot of MOFA Factor 1 (x-axis) and MOFA Factor 2 (y-axis). Cells are coloured according to their lineage assignment (n=840). c, Scatter plots showing differential DNA methylation (%, x-axis) and chromatin accessibility (%, y-axis) at lineage-specific enhancers at E7.5. Comparisons are ectoderm vs non-ectoderm cells (left), endoderm vs non-endoderm cells (middle) and mesoderm vs non-mesoderm cells (right). Black dots depict gene-enhancer pairs with significant changes in RNA expression and methylation or accessibility (Pearson’s chi-squared test, FDR<10%). d, Transcription Factor (TF) motif enrichment at lineage-defining enhancers. Shown is motif enrichment (Fisher’s exact test, -log10 q-value, y-axis) versus differential RNA expression (log fold change, x-axis) of the corresponding TF. The analysis is performed separately for ectoderm- (left), endoderm- (middle) and mesoderm- (right) defining enhancers. TFs with significant motif enrichment (FDR<1%) and differential RNA expression (edgeR quasi-likelihood test, FDR<1%) are labelled.

