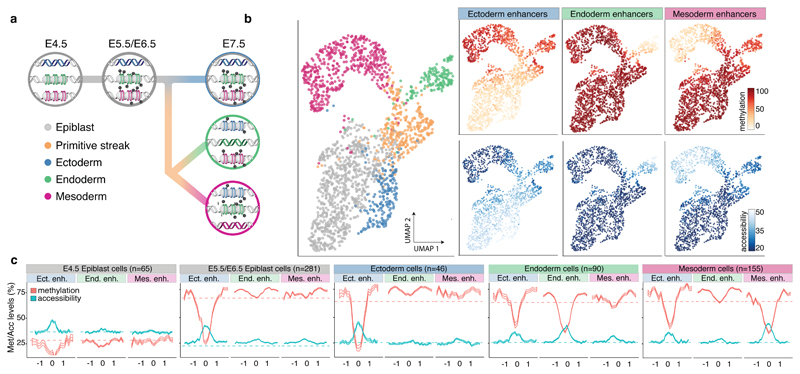
Fig. 3. DNA methylation and chromatin accessibility dynamics at lineage-defining enhancers across development.
a, Illustration of the hierarchical model of enhancer epigenetic dynamics associated with germ layer commitment. b, UMAP projection based on the MOFA factors inferred using all embryonic cells (n=1,928). In the left plot the cells are coloured by lineage. In the right plots cells are coloured by average methylation (%, top) or accessibility (%, bottom) at lineage-defining enhancers. For cells with only RNA expression data, the MOFA factors were used to impute the methylation and accessibility levels. c, Profiles of methylation (red) and accessibility (blue) at lineage-defining enhancers across development. Shown are running averages in 50bp windows around the center of the ChIP-seq peaks (2kb upstream and downstream). Solid lines display the mean across cells and shading displays the standard deviation. E5.5 and E6.5 epiblast cells show similar profiles and are combined. Dashed horizontal lines represent genome-wide background levels for methylation (red) and accessibility (blue).

