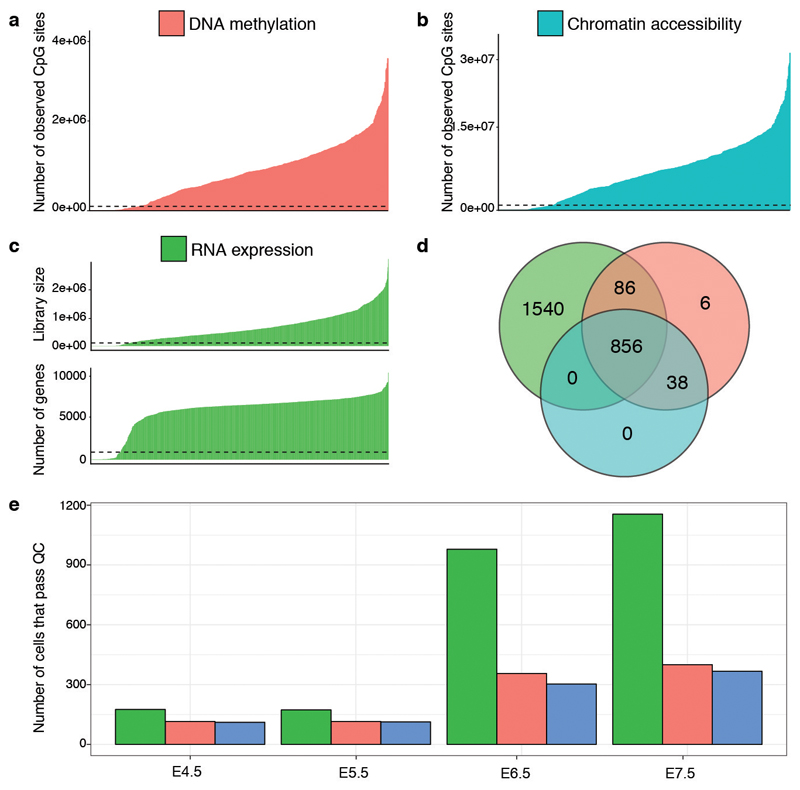
Extended Data Fig. 1. scNMT-seq quality controls.
a-b, Number of observed cytosines in (a) CpG (red) or (b) GpC (blue) contexts respectively. Each bar corresponds to one cell. Cells are sorted by total number of CpG or GpC sites, respectively. Cells below the dashed line were discarded on the basis of poor coverage. c, RNA library size per cell. Top, total number of reads and bottom, number of expressed genes (read counts>0). Cells below the dashed line were discarded on the basis of poor coverage. d, Venn Diagram displaying the number of cells that pass quality control for RNA expression (green), DNA methylation (red), chromatin accessibility (blue). e, Number of cells that pass quality control for each molecular layer, grouped by stage. Note that for 1,419 out of 2,524 total cells only the RNA expression was sequenced.

