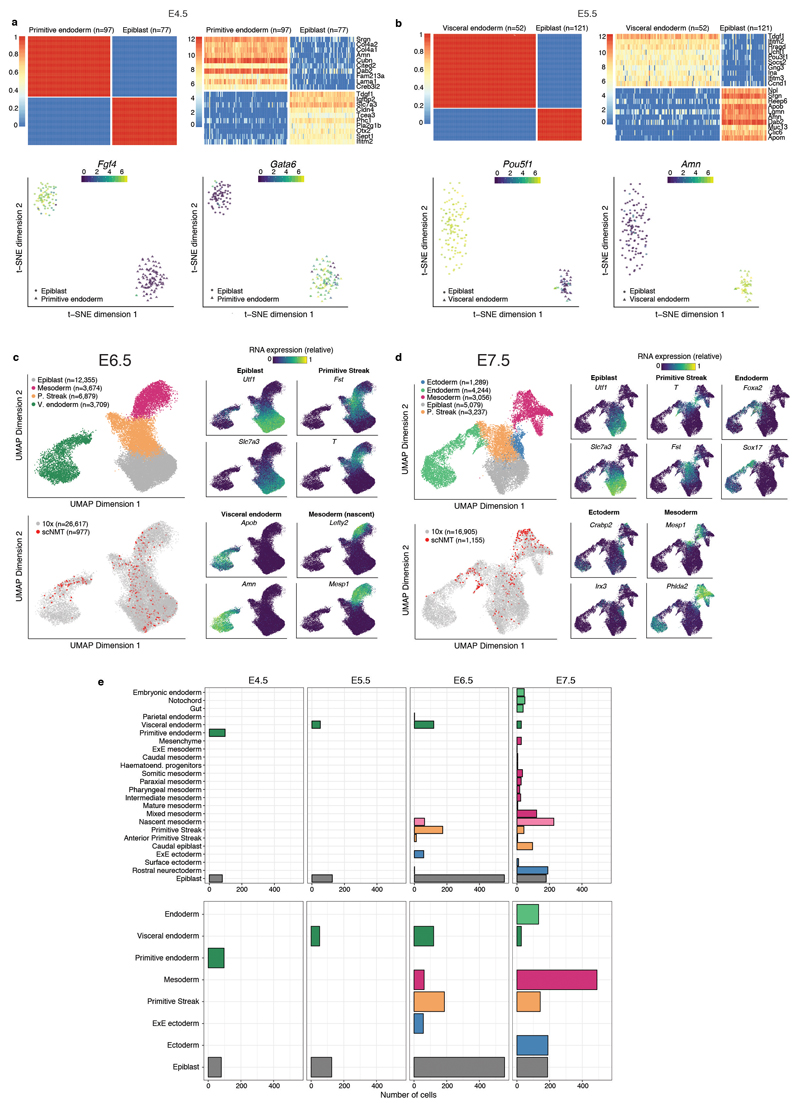
Extended Data Fig. 2. Cell type assignments based on RNA expression.
a-b, Lineage assignment of a, E4.5 cells (N=175) and b, E5.5 cells (N=173). Shown are (top left) SC3 consensus plots representing the similarity between cells based on the averaging of clustering results from multiple combinations of clustering parameters. (Top right) Heatmap showing the RNA expression (log normalised counts) of the ten most informative gene markers for each cluster. (Bottom left) t-SNE representation of the RNA expression data coloured by the expression of Fgf4 and Pou5f1, known E4.5 and E5.5 epiblast markers50,51, respectively. (Bottom right) t-SNE representation of the RNA expression data coloured by the expression of Gata6 and Amn, known E4.5 primitive endoderm and E5.5 visceral endoderm markers52. c-d, Lineage assignment of c, E6.5 cells (N=977) and d, E7.5 cells (N=1,155). Left: UMAP projection of the atlas data set (stages E6.5 to E7.0 to assign E6.5 cells and E7.0 to E8.0 to assign E7.5 cells). In the top-left panel the cells are coloured by lineage assignment. In the bottom-left panel, the cells coloured in red are the nearest neighbors that were used to transfer labels to the scNMT-seq data set. In the right panels cells are coloured by the relative RNA expression of lineage marker genes. e, Left: Number of cells per lineage, using the maximally resolved cell types reported in4. Right: Number of cells per lineage after aggregation of cell types belonging to the same germ layer or extraembryonic tissue type, as used in this study.

