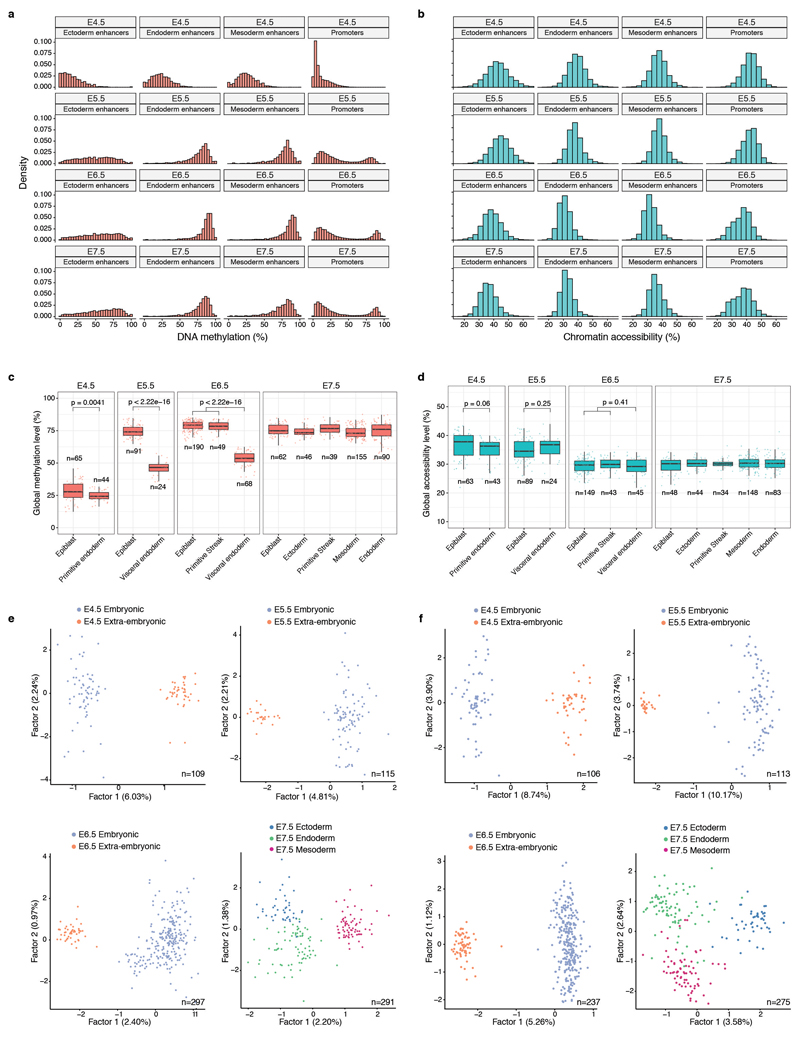
Extended Data Fig. 3. Global methylation and chromatin accessibility dynamics.
a-b, Distribution of a, DNA methylation and b, chromatin accessibility levels per stage and genomic context. When aggregating over genomic features, CpG methylation and GpC accessibility levels (%) are computed assuming a binomial model, with the number of trials being the total number of observed CpG (or GpC) sites and the number of successes being the number of methylated CpG (or GpC) sites (Methods). Importantly, this implies that DNA methylation and chromatin accessibility are quantified as a percentage and are not binarised into ”low” or ”high” states. As this Extended Data Fig. shows, the distribution of DNA methylation and chromatin accessibility across loci (after aggregating measurements across all cells) is largely continuous and does not show bimodality. Hence, a binarisation approach that is sometimes used for differentiated cell types would not be a good representation of the data. c-d, Box plots showing the distribution of genome-wide c, CpG methylation levels or d, GpC accessibility levels per stage and lineage. Each dot represents a single cell. At a significance threshold of 0.01 (t-test, two-sided), the global DNA methylation levels differ between embryonic and extraembryonic lineages, but the global chromatin accessibility levels do not. e-f, Dimensionality reduction of e, DNA methylation and f, chromatin accessibility data. To perform dimensionality reduction while handling the large amount of missing values we used a Bayesian Factor Analysis model (Methods). Shown are scatter plots of the first two latent factors (sorted by variance explained) for models trained with cells from the indicated stages. From E4.5 to E6.5, cells are coloured by embryonic and extraembryonic origin. At E7.5 cells are coloured by the primary germ layer. All lineage assignments were made using the cells’ corresponding RNA expression level (Extended Data Fig. 2). The fraction of variance explained by each factor is displayed in parentheses. The input data was M-values quantified over DNase I hypersensitive sites profiled in Embryonic Stem Cells.

