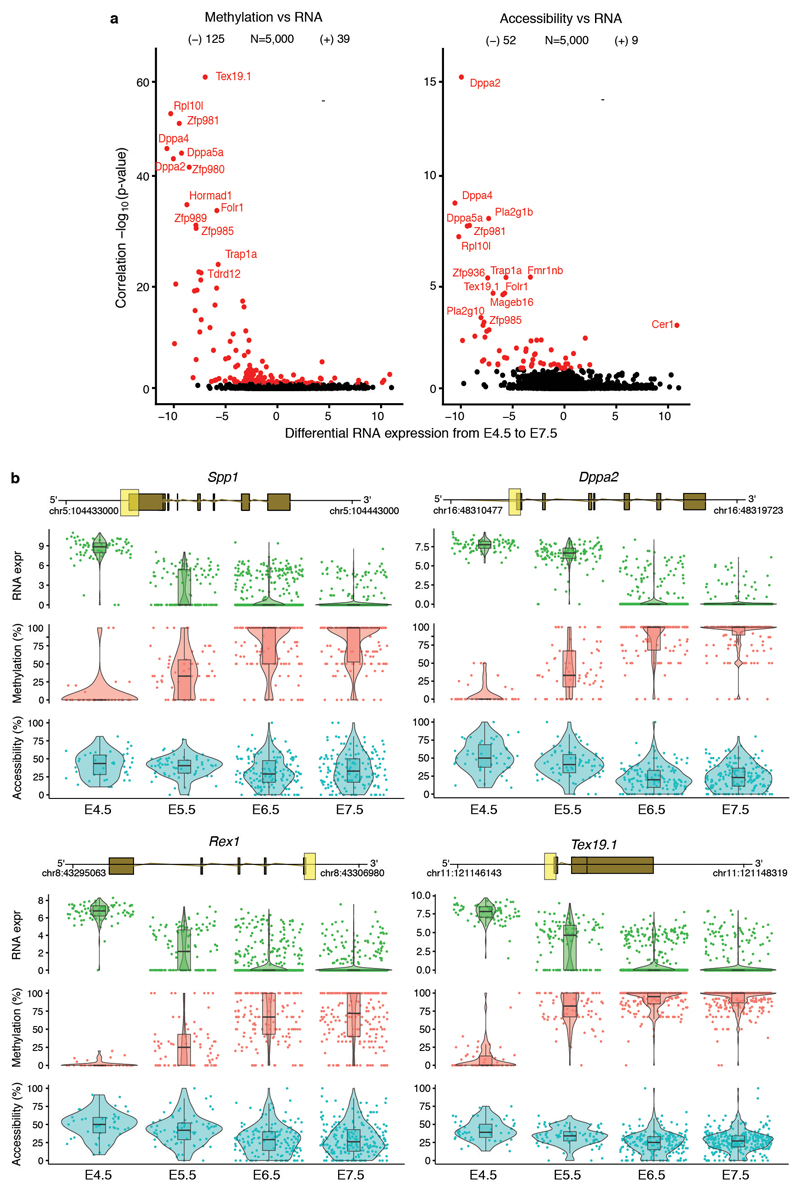
Extended Data Fig. 4. DNA methylation and chromatin accessibility changes in promoters are associated with repression of early pluripotency and germ cell markers.
a, Volcano plots display differential RNA expression levels between E4.5 and E7.5 cells (in log2 counts, x-axis) versus adjusted correlation p-values (FDR < 10% in red, Benjamini-Hochberg correction). Left plot shows DNA methylation versus RNA expression correlations and the right plot shows chromatin accessibility versus RNA expression. Negative values for differential RNA expression indicates higher expression in E4.5, whereas positive values indicate higher expression in E7.5. b, Illustrative examples of epigenetic repression of early pluripotency and germ cell markers. Box and violin plots show the distribution of RNA expression (log2 counts, green), DNA methylation (%, red) and chromatin accessibility (%, blue) levels per stage. Box plots show median coverage and the first and third quartile, whiskers show 1.5x the interquartile range. Each dot corresponds to one cell. For each gene a genomic track is shown on top, where the promoter region that is used to quantify DNA methylation and chromatin accessibility levels is highlighted in yellow.

