Figure 2.
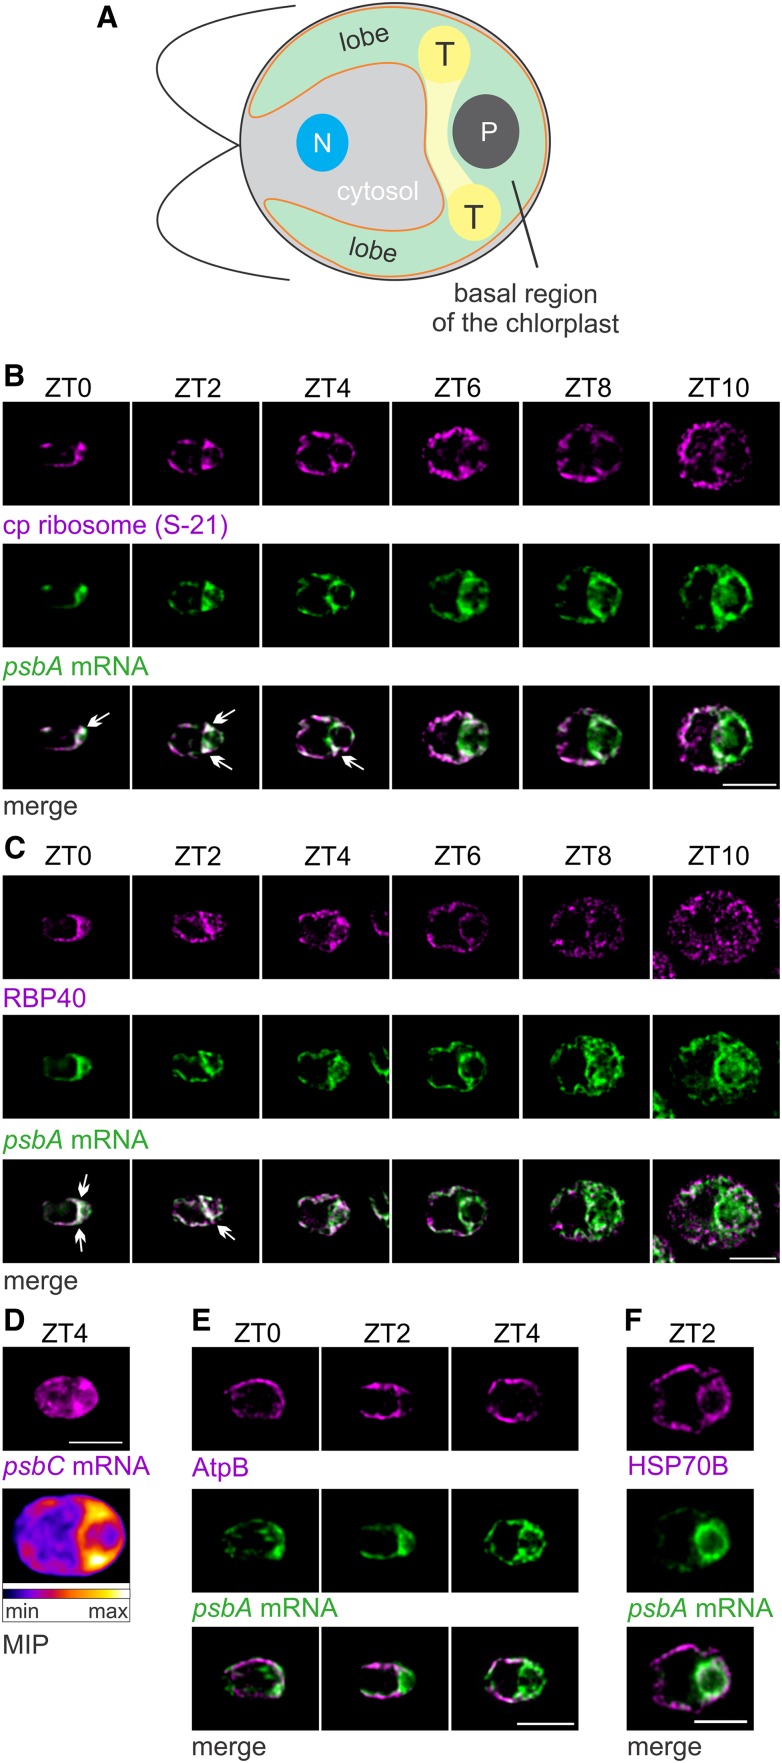
Growing Chloroplasts during the Light Phase of the Diel Cycle Show Spatiotemporal Patterning of Markers of PSII Biogenesis.
(A) An illustration of a Chlamydomonas cell shows the chloroplast (green) with its T-zone (T, yellow), basal region, lobes, envelope (orange) and pyrenoid (P). Also shown are the cytosol and the nucleus (N).
(B) Epifluorescence microscopy images reveal the distributions of chloroplastic ribosomal protein S-21 and the psbA mRNA enriched in the T-zone of ZT0 cells (n = 27), ZT2 cells (n = 28), in approximately half of the ZT4 cells (n = 45), but not in most ZT6 cells (n = 78), ZT8 cells (n = 44), or ZT10 cells (n = 41). Arrows indicate the strongest overlaps. Each signal was manually adjusted to similar brightness across all images in each panel to allow comparisons of in situ distributions.
(C) RBP40 and the psbA mRNA localized to the T-zone in approximately half of the ZT0 cells (n = 123), in most ZT2 cells (n = 136) and ZT4 cells (n = 129), but not in most ZT6 cells (n = 117), ZT8 cells (n = 101), or ZT10 cells (n = 113).
(D) The psbC mRNA was enriched in the T-zone of ZT4 cells (top image). The heat map shows average signal intensities in a maximal intensity projection (MIP) of all cells in this data set (n = 56).
(E) The thylakoid membrane complex ATP synthase (AtpB) was not localized to the T-zone in most ZT0 cells (n = 18), ZT2 cells (n = 64), and ZT4 cells (n = 83).
(F) A protein of the chloroplast stroma (HSP70B) was not localized to the T-zone (marked by the psbA mRNA) in ZT2 cells (n = 79).
Bright-field images of all cells shown here are presented in Supplemental Figure 3 to show their proper anterior-posterior orientations (from left to right). Bars = 5.0 µm.

