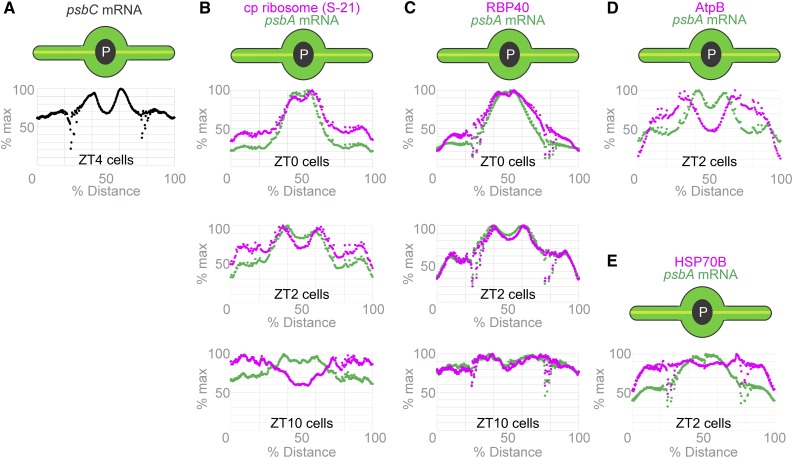
Figure 3.
Plots of Average Fluorescence Signal Intensity along the Chloroplast Axis from All Cells of Each Data Set Support T-Zone Localization of the Translation Markers Early in the Light Phase of the Diel Cycle.
Chloroplasts are illustrated as their axis (yellow line) is presented on the horizontal axis of each graph. Our macro determines the average signal intensity along this axis.
(A) The average signal intensity of the psbC mRNA FISH signal in ZT4 cells (Figure 2D; n = 56) is plotted versus position on the chloroplast axis.
(B) to (E) The average signal intensities of the psbA mRNA FISH signal (green) and the IF signals of the S-21 chloroplastic ribosomal protein (ZT0, n = 27; ZT2, n = 28; and ZT10, n = 41; [B]), RBP40 (ZT0, n = 111; ZT2, n = 118, and ZT10, n = 123; [C]), the AtpB subunit of ATP synthase (n = 65; [D]), and the stromal marker HSP70B (n = 93; [E]) are plotted along the chloroplast axis (as percentage of the total length).

