Figure 5.
The T-Zone Is the Primary Location of Chlorophyll Biosynthesis.
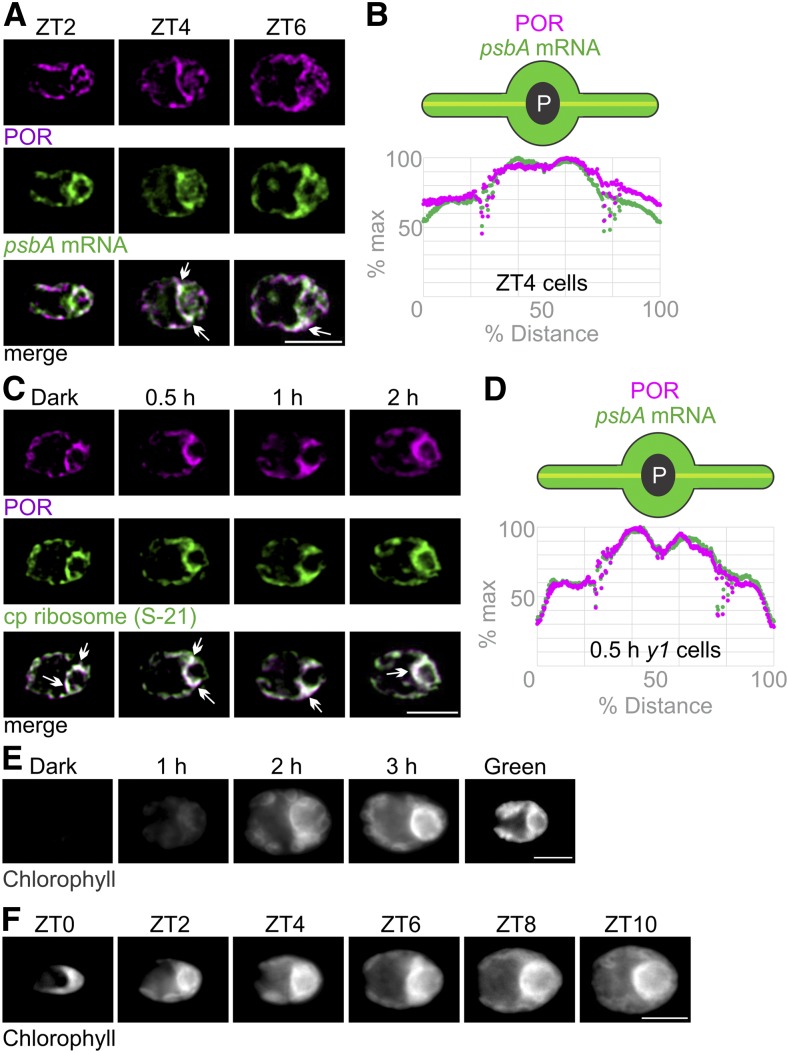
(A) Epifluorescence microscopy images show that the fluorescent signals of POR (magenta) and the psbA mRNA (green) were throughout the chloroplast in most ZT2 cells (n = 95) and colocalized in the T-zone (arrows) in most ZT4 cells (n = 73) and ZT6 cells (n = 47). Bar = 5.0 µm.
(B) For ZT4 cells, this pattern was confirmed by plots of average signal intensities versus position on the chloroplast axis (n = 112).
(C) Images show the IF signals of POR (magenta) and S-21 (green) colocalized in the T-zones of most dark-y1 cells (n = 111), 0.5 h-y1 cells (n = 62), 1 h-y1 cells (n = 71), and 2 h-y1 cells (n = 56). Bar = 5.0 µm.
(D) This pattern was confirmed for 0.5 h-y1 cells by plots of average signal intensities versus position on the chloroplast axis (n = 33).
(E) In live-imaged dark-y1 cells (n = 62), no autofluorescence was seen because they lack chlorophyll. The strongest chlorophyll fluorescence was seen in the T-zones of most live 1 h-y1 cells (n = 52), 2 h-y1 cells (n = 40), and 3 h-y1 cells (n = 40) and throughout the chloroplast of all green-y1 cells (n = 55). Bar = 5.0 µm.
(F) At ZT0 (n = 14), chlorophyll fluorescence was higher in the basal region than in the lobes, but not particularly localized to the T-zone. The strongest chlorophyll autofluorescence was seen in the T-zones of most cells at ZT2 (n = 16), ZT4 (n = 15), ZT6 (n = 19), ZT8 (n = 17), and ZT10 (n = 13). Bar = 5.0 µm.

