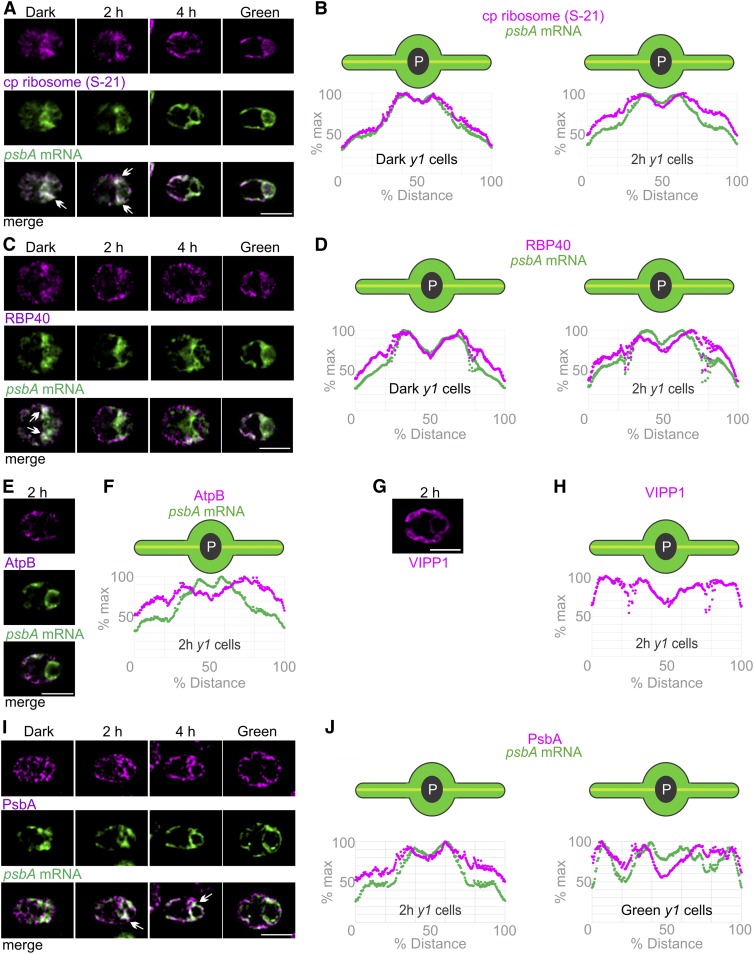
Figure 6.
The T-Zone in Greening y1 Cells Revealed by the in Situ Localization of Translation Markers.
(A) Images show the strongest signals from chloroplastic ribosomal protein S-21 (magenta) and the psbA mRNA (green) colocalized in the T-zone in most dark-y1 cells (n = 91) and 2 h-y1 cells (n = 145) and approximately half of 4 h-y1 cells (n = 138) but not in most green-y1 cells (n = 89). Arrows indicate where the strongest signals from both channels overlap in the T-zone. Bar = 5.0 µm.
(B) Plots of the average signal intensities versus position on the chloroplast axis confirm these patterns in dark-y1 cells (n = 52) and 2 h-y1 cells (n = 95).
(C) Cell images show RBP40 (magenta) and the psbA mRNA (green) colocalized in the T-zone in approximately half of dark-y1 cells (n = 41) and in minorities of 2 h-y1 cells (n = 75) and 4 h-y1 cells (n = 103) but not in green-y1 cells (n = 82). Bar = 5.0 µm.
(D) Plots of average intensities of these signals showed peaks in the T-zone of dark-y1 cells (n = 65) and 2 h-y1 cells (n = 109).
(E) In 2 h-y1 cells, AtpB (magenta) was maximal in the lobes and not localized to the T-zone with the psbA mRNA (green) in most 2 h-y1 cells (n = 76). Bar = 5.0 µm.
(F) This was confirmed by a plot of the AtpB IF signal intensity versus position on the chloroplast axis (n = 54).
(G) VIPP1, a marker for thylakoids and stroma, also was not localized to the T-zone in most 2 h-y1 cells (n = 51). Bar = 5.0 µm.
(H) This was confirmed by a plot of the VIPP1 IF signal intensity versus position on the chloroplast axis (n = 44).
(I) PsbA is a marker for newly synthesized PSII proteins early in y1 greening (see text); it was T-zone localized (arrows) in most 2 h-y1 cells (n = 95) and 4 h-y1 cells (n = 40) but not in most dark-y1 cells (n = 79) or any green-y1 cells (n = 36). The PsbA signal was manually enhanced in the dark-y1 cell to allow comparisons of its in situ distributions but not relative levels across the conditions. Bar = 5.0 µm.
(J) The average intensity of the PsbA IF signals was maximal in the T-zone in 2 h-y1 cells (n = 89) but not in green-y1 cells (n = 34).

