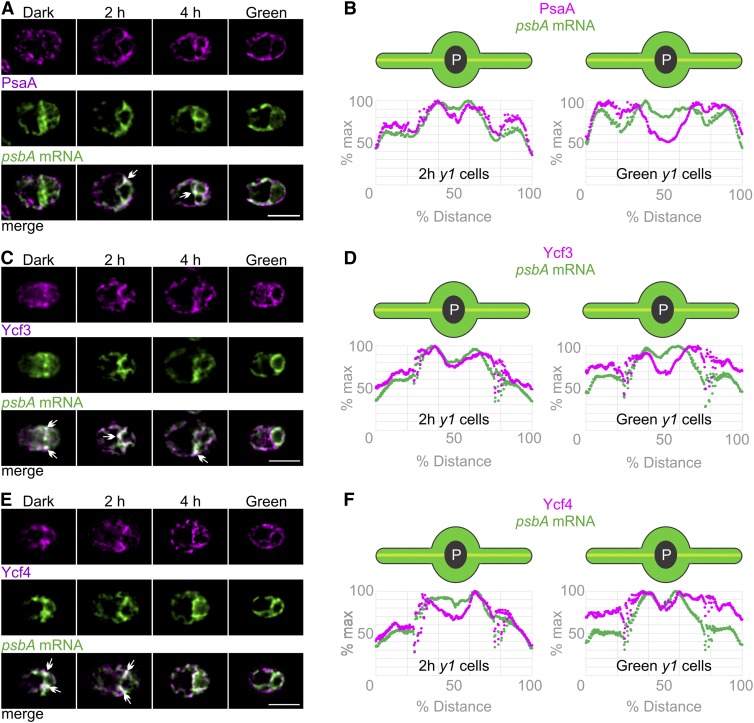
Figure 7.
Localization of PSI Subunit Synthesis and Assembly to the T-Zone of Greening y1 Cells.
(A) Overlap of the strongest signals of PSI subunit PsaA (magenta) and the psbA mRNA (green) in the T-zone was seen in most 2 h-y1 cells (n = 59) and in approximately half of 4 h-y1 cells (n = 30) but not in dark-y1 cells (n = 75) or green-y1 cells (n = 52). PsaA signal was enhanced in the dark-y1 cell to allow comparisons of its distributions. Arrows indicate where the strongest signals from both channels overlap in the T-zone. Bar = 5.0 µm.
(B) The colocalization in the T-zone of 2 h-y1 cells (n = 73) but not green-y1 cells (n = 43) was confirmed by plots of the average signal intensities versus the chloroplast axis.
(C) Epifluorescence microscopy images show the strongest signals from Ycf3 (magenta) and the psbA mRNA (green) colocalized in the T-zone in most dark-y1 cells (n = 38), in approximately half of 2 h-y1 cells (n = 84) and 4 h-y1 cells (n = 136), but not in green-y1 cells (n = 35). Bar = 5.0 µm.
(D) T-zone localization of both signals in 2 h-y1 cells (n = 90) but not green-y1 cells (n = 32) was confirmed by plots of the average signal intensities versus position on the chloroplast axis.
(E) The strongest signals of Ycf4 (magenta) and the psbA mRNA (green) colocalized in the T-zone in dark-y1 cells (n = 40), in 2 h-y1 cells (n = 55), and in approximately half of 4 h-y1 cells (n = 57) but not in green-y1 cells (n = 64). Bar = 5.0 µm.
(F) T-zone localization of both signals in 2 h-y1 cells (n = 57) but not green-y1 cells (n = 50) was confirmed by plots of the average signal intensities.

