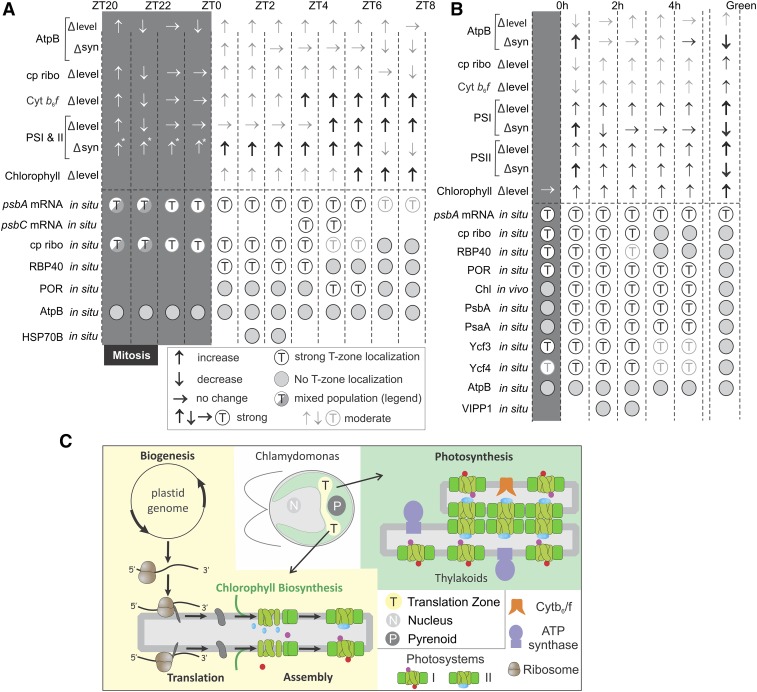
Figure 8.
Summaries of the Results.
(A) For the diel cycle interval ZT20-ZT8, arrows indicate changes in steady state level (∆ level) and synthesis rate (∆syn) of the marker proteins for the listed complexes as follows: ↑, increase; ↓, decrease; thick ↑, drastic increase; gray ↑, slight increase; →, no change. Below the broken line, for each mRNA or marker protein, T-zone localization is indicated by open circles and nonlocalization by shaded circles. Sectored circles indicate mixed populations of premitotic and postmitotic cells showing nonlocalization or T-zone localization, respectively. Faded circles indicate weak T-zone localization. The intervals of the dark and light phases examined have shaded and white backgrounds, respectively. Absence of a circle indicates not determined. Abbreviations and marker proteins in situ (in parentheses) are as follows: ATP synthase (AtpB), AtpB; chloroplastic ribosome (S-21), cp ribo; Cytb6f complex (Cyt f), Cytb6f; PSI and PSII (PsaA and PsbD, respectively), PSI and II. Asterisks indicate that data are from Howell et al. (1977) and Lee and Herrin (2002).
(B) The results obtained with greening y1 are summarized as described for (A). Changes in protein level and synthesis rates of the marker proteins (top arrows) are presented for reference to our in situ results (bottom circles). Levels and synthesis rates of the markers of ATP synthase, PSI, and PSII were reported previously (Malnoë et al., 1988).(C) Our model shows the role of the T-zone (yellow) as a compartment in the chloroplast which is the location of photosystem subunit translation and assembly as well as chlorophyll biosynthesis and distinct from the distribution of photosynthetic thylakoid membranes throughout the chloroplast (green).

