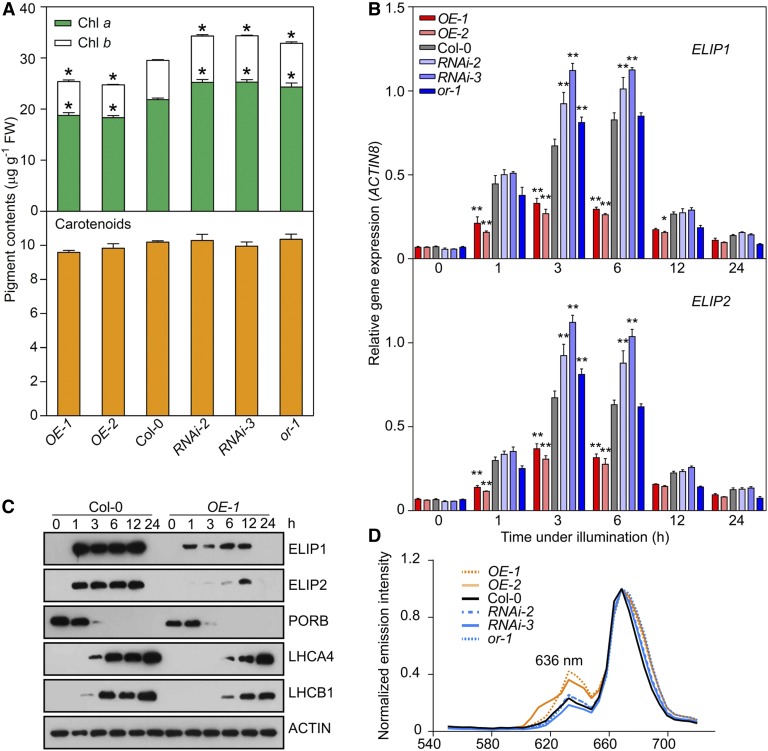
Figure 2.
OR Regulates the Biosynthesis of Chlorophylls and ELIPs.
(A) Chlorophyll and carotenoid contents in OR-overexpressing (OE) and OR-silencing (RNAi) lines, Col-0, and the or-1 mutant. Seedlings were germinated in dark for 4 d and then illuminated for 12 h. Data are means ± se (five pools of seedlings from separate plates were used). Asterisks indicate significant differences between the transgenic lines and Col-0 (Student’s t test, P < 0.05). FW, fresh weight.
(B) Expression of ELIP1 and ELIP2 during the transition from dark (0 h) to light conditions for 1, 3, 6, 12, and 24 h. Transcript abundance of each gene was quantified by qPCR. Relative expression was calculated as the ratio between the transcript abundance of the gene studied and that of ACTIN8 in the same sample. Data are means ± se (five pools of seedlings from separate plates were used). Asterisks indicate significant differences between the transgenic lines and Col-0 (two-way ANOVA followed by Dunnett’s multiple comparison test, *P < 0.05, **P < 0.01 or better).
(C) Immunoblot analysis showing the abundances of ELIPs, PORB, LHCA4, and LHCB1 in Col-0 and OR overexpression line OE-1 during the transition from dark (0 h) to light conditions for 1, 3, 6, 12, and 24 h. ACTIN was probed as a loading control.
(D) Fluorescence emission spectra showing relative fluorescence of Pchlide (fluorescence emission maximum at 636 nm) in transgenic lines and Col-0 in planta. For each sample, five cotyledon positions were measured to calculate an average spectrum, and the maximum emission value was set as 1.

