Figure 1.
Identification of Genes Differentially Expressed in the FtsH3down Mutant.
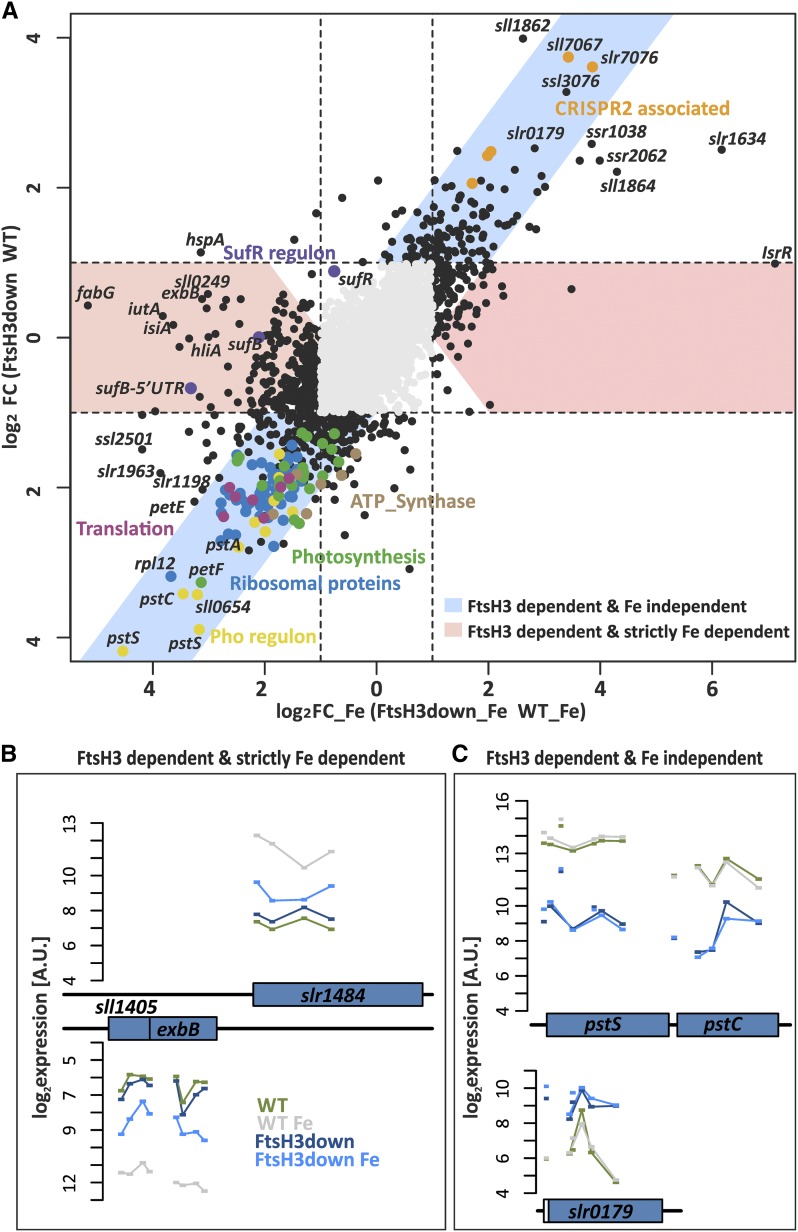
(A) Scatterplot of the transcriptomic differences in log2 FC_Fe (x axis) and log2 FC (y axis), where FC and FC_Fe correspond to FCs between FtsH3down and the wild type (WT) under standard conditions and after Fe depletion, respectively. The threshold FC is indicated by dashed lines. Black or colored points represent transcriptional features with a significant FC (, q – value ≤ 0.05). Important functionally connected features are color coded.
(B) and (C) Part of a genome-wide overview of signal intensities. The mean normalized log2 expression values (scale on left; A.U., arbitrary units) of the four different microarray experiments are plotted for each probe as short horizontal bars that span the corresponding hybridization region. All probes of a single RNA feature are connected by lines. The following color coding was used: dark green, wild-type expression before Fe depletion (WT); light green, WT expression after Fe depletion (WT_Fe); dark blue, FtsH3down expression before Fe depletion (FtsH3); light blue, FtsH3down expression after Fe depletion (FtsH3_Fe). (B) FtsH3 dependent and strictly Fe dependent genes ( and ), as represented by slr1484 and sll1404. (C) Example of FtsH3 dependent and Fe independent genes. Genes downregulated independently of Fe (log2 FC_Fe ∼ log2 FC ≤ –1) are represented by sll0680 and sll0681 (belonging to the Pho regulon) and genes upregulated independently of Fe (log2 FC_Fe ∼ log2 FC ≤ –1) by sll0179 (encoding a hypothetical protein).

