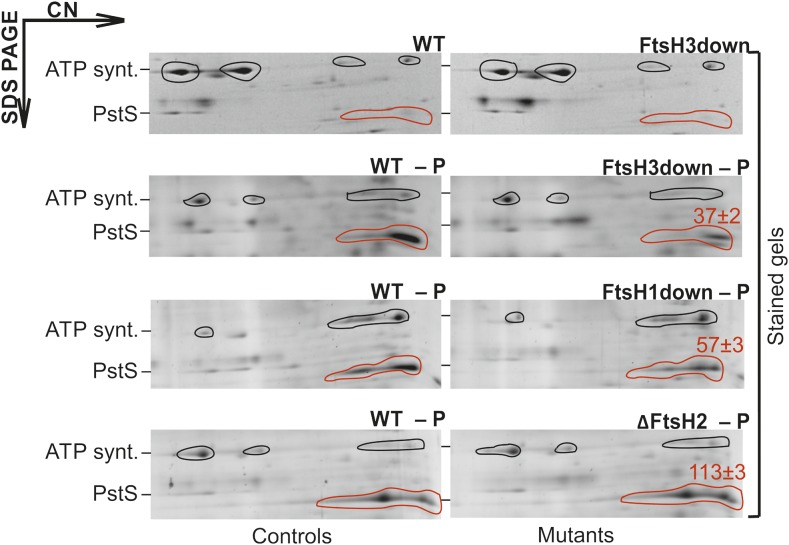
Figure 2.
Differences in the Accumulation of PstS in FtsH Mutants under P Depletion.
Protein complexes isolated from membranes of FtsH mutants and their respective wild-type controls (WT) grown under nutrient sufficiency or after 72 h of P depletion (‒P) were analyzed by 2D CN/SDS-PAGE. The 2D gel was stained with Sypro Orange. Each loaded sample contained 5 μg of chlorophyll a. The overall PstS signal is indicated by a red outline, and the AtpA/B subunits of ATP synthase (ATP synt.) used for normalization by a black outline. The identity of ATP synt. and PstS proteins was verified by MS. Red numbers indicate the percentage of the PstS protein in the mutant related to the amount of PstS in the wild-type control, normalized to ATP synthase; means of three measurements ± sd. Quantification of bands was performed using ImageQuant TL software (GE Healthcare).

