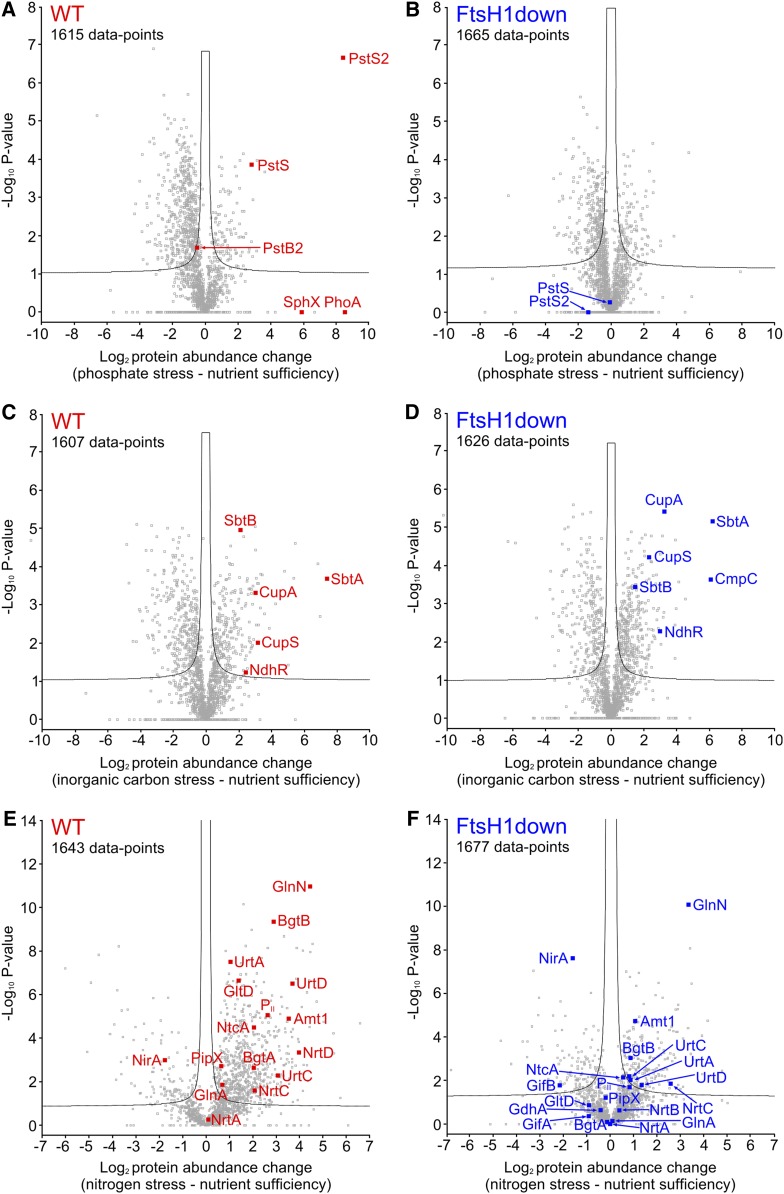
Figure 3.
Comparison of Proteomic Changes between the Wild-Type and FtsH1down Mutant Synechocystis Strains in Response to P, Ci, and N Stress.
(A) to (F) Volcano plots were constructed using Perseus (see Methods), with (A), (C), and (E) showing protein abundance changes in the wild-type control (WT) in response to P, Ci, and N stress, respectively. (B), (D), and (F) show corresponding changes in the FtsH1down mutant. P-values were calculated by a t test incorporating permutation-based false discovery rate with 250 randomizations of the complete data set for each comparison. The number of data points in each panel is indicated, and the significance threshold corresponding to a false discovery rate = 0.05 is shown by a black line. Proteins relevant to this study that were identified and therefore quantifiable by MaxQuant in at least one replicate are included in the statistical analysis and highlighted in red (wild type) or blue (FtsH1down). Other relevant proteins were not identified and therefore not quantifiable in either one or both of the nutrient sufficiency/stress analyses. Analyses from P and Ci stress were n = 3 (1× biological and 3× technical replicates) and analysis from N stress was n = 9 (3× biological and 1× technical replicates). Further details of both the highlighted proteins and those not quantified are given in Supplemental Data Set 3.

