Figure 5.
Protein Distribution and Phycobilin Levels in FtsH1down under N Depletion.
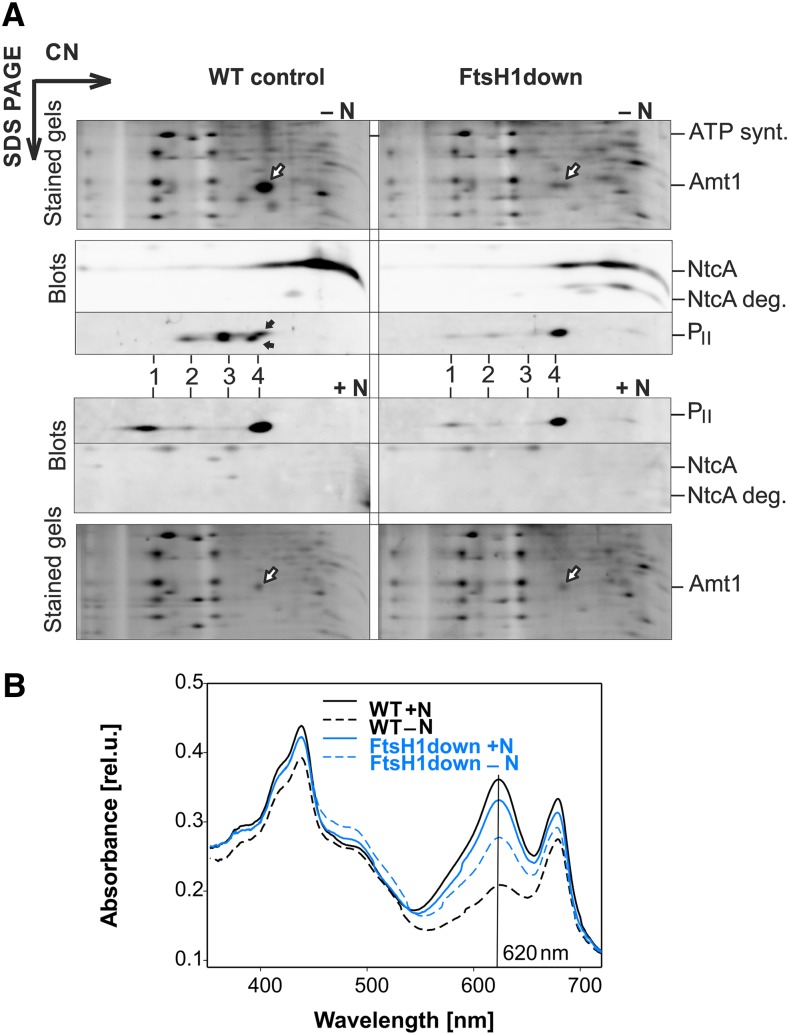
Cells of FtsH1down and the respective wild-type control (WT) were exposed for 24 h to N-deplete conditions (‒N) or grown for another 24 h under N-replete conditions (+N).
(A) Protein complexes isolated from +N/‒N cells were analyzed by 2D CN/SDS-PAGE. The 2D gel was stained with Sypro Orange and used for immunodetection with specific antibodies against NctA and PII. White arrows indicate Amt1; the identity of Amt1 was verified by MS by Linhartová et al. (2014). Black arrows point to a shift in PII migration in the SDS gel, likely due to different phosphorylation states in the WT − N. NtcA was not detectable by immunodetection under N+. Other designations: ATP. synt., AtpA/B subunits of ATP synthase; NtcA deg., putative degradation product of NtcA; 1 to 4, different PII distribution in the CN direction. Each loaded membrane fraction sample contained 5 µg of chlorophyll a.
(B) Whole-cell absorption spectra were measured with cell suspensions of the same OD750 of 0.1. Absorbance at the phycobilin peak maximum (620 nm), indicated by the solid line, reflects the level of phycobiliproteins in the cell. rel.u., relative units.

