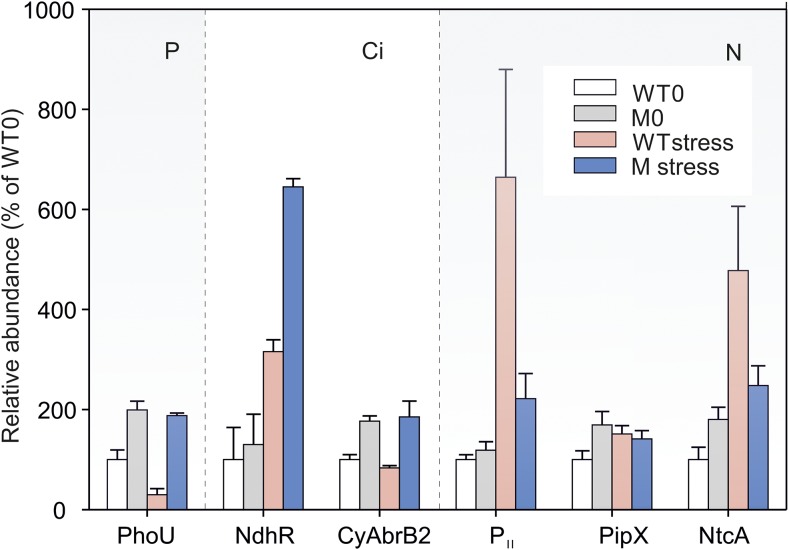
Figure 7.
Accumulation of Transcriptional Regulators under Nutrient Replete/Deplete Conditions.
Proteins extracted from cells of the FtsH1down mutant (M) and its respective wild-type control (WT) grown in nutrient sufficiency (0) or under nutrient depletion (stress) were quantified (except PhoU) as described in Methods. PhoU was quantified manually from extracted ion chromatograms (see Supplemental Data Set 3). PhoU was measured under P depletion, NdhR and CyAbrB2 under Ci depletion, and PII, PipX, and NtcA under N depletion. Relative abundances were expressed as percentage of wild type 0 (WT0) and were calculated from the values shown in the Supplemental Data Set 3. Mean ratio ± sd was n = 3 for PhoU, NdhR, and CyAbrB2, whereas n = 9 (3× biological and 3× technical replicates) for proteins under N stress. Although SDs for PII and NtcA were relatively high in wild type N stress, the difference between the wild type and mutant was statistically significant at P < 0.001 (Figures 3E and 3F; Supplemental Data Set 3).

