Figure 10.
The Cluster Oxidation Products Influence Florivore Behavior and Floral Microbial Populations.
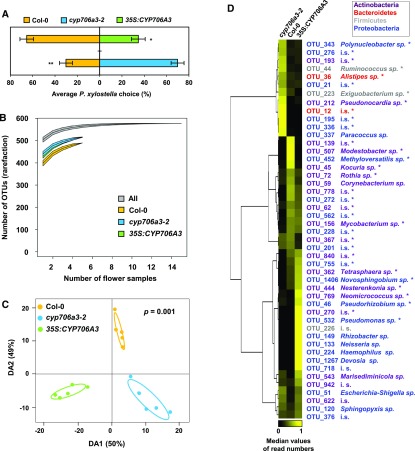
(A) Feeding preference of larvae of Plutella xylostella for buds from Col-0, cyp706a3-2, and 35S:CYP706A3 in dual-choice test. Data represent the average proportion of consumed buds for 30 individual insects (±se). Statistically significant differences are indicated (Wilcoxon: *p = 0.0265, **p = 0.0019).
(B) Diversity of OTUs present on Col-0 flowers was lower than those of cyp706a3-2 and 35S:CYP706A3 when analyzed using a Chao rarefaction test. Graph shows OTUs accumulation curves for each flower line when increasing the number of flower samples analyzed (rarefaction). Data are means ± se from 5 biological replicates (pooled inflorescences from 5 individual plants): Col-0 = 538 ± 13, cyp706a3-2 = 565 ± 13, and 35S:CYP706A3 = 571 ± 15. Curve thickness represents ± se.
(C) Abundance of OTUs (counts) detected on the flowers of Col-0, cyp706a3-2, and 35S:CYP706A3 was analyzed by a PLS-DA using the three lines as discriminant factor. Graph shows the difference in overall bacterial communities for each of five replicates from the three different lines. A cross-validation test with 999 permutations confirms the significant difference between bacterial communities among lines (P = 0.001).
(D) Differential flower-associated bacterial populations between Col-0, cyp706a3-2, and 35S:CYP706A3 flowers. Heatmap represents the relative abundance of specific OTUs being significantly different between a pair of lines based on a Wilcoxon rank sum test (n = 5, P < 0.05). OTUs that significantly differed between all lines are marked with an asterisk (Kruskal-Wallis rank sum test, n = 5, P < 0.05). OTUs are hierarchically clustered based on the average number of reads per flower line with uncentered correlation. Each row gives the median proportional number of reads in each of the flower lines, that is, each row sums up to 1 to facilitate comparison between lines and OTUs despite differences in total read counts. Each color represents a phylum (Actinobacteria, Bacteroidetes, Firmicutes, or Proteobacteria) as indicated in the box. Taxonomic designation was based on the percentage of identity to reference sequences in the SILVA database and indicated at the genus level unless unknown (i.s., incertae sedis). Detailed taxonomic identification is presented in Supplemental Table 4. Statistics can be found in Supplemental Data Set 2.

