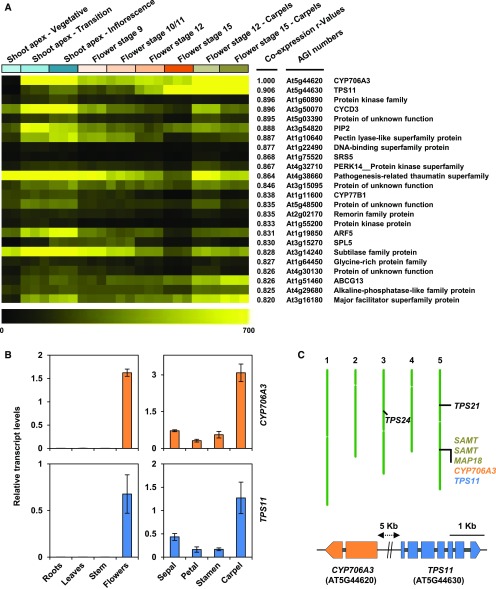
Figure 2.
CYP706A3 and TPS11 Are Coexpressed and Physically Clustered on Chromosome 5 in Arabidopsis.
(A) Expression heatmap of the 25 genes most coregulated with CYP706A3. Analysis was performed using the BAR Expression Angler tool and the AtGenExpress extended Tissue Compendium data set (Toufighi et al., 2005). The heatmap shows expression levels in selected flowers’ tissues: vegetative shoot apex; transition and inflorescence tissues; flower stages 9, 10/11, 12, 15; and carpels of flower stages 12 and 15. Pearson correlation coefficients (r values) of each gene coexpressed with CYP706A3, AGI numbers of the genes, and gene annotations from The Arabidopsis Information Resource are shown.
(B) Relative transcript levels of CYP706A3 and TPS11 in plant (left) and flower (right) organs. Relative transcript levels were determined by RT-qPCR (details in Methods). Results represent means ± se of four biological replicates (pooled tissues from individual plants).
(C) Map of the CYP706A3 and TPS11 gene cluster on chromosome 5 (top) and representation of introns/exons and genomic distances between both genes (bottom). The genomic localizations of TPS24, TPS21, and cluster-neighboring genes are also indicated. Numbers 1 to 5 indicate chromosomes 1 to 5. Line represents chromosome 5 on which are located the exons (CYP706A3: orange-filed, TPS11: blue-filled boxes) and introns (gray-filled boxes).

