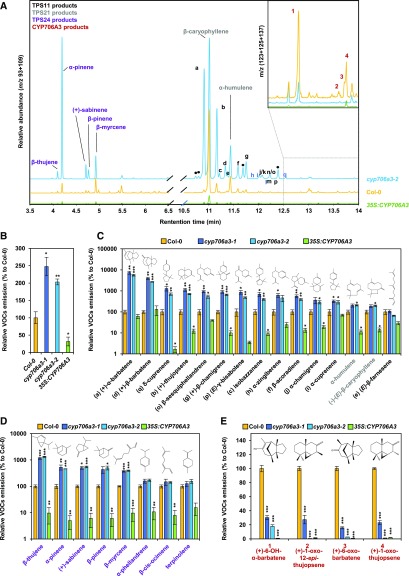
Figure 6.
Flower-emitted VOCs in CYP706A3 Mutants.
(A) GC-MS chromatograms of headspace collected from flowers of Col-0, cyp706a3, and CYP706A3 overexpressing lines. Chromatograms show the relative abundance of the sum of extracted ion current (m/z 93 + 109) to display the major mono- and sesquiterpenes. Chromatograms in the inset show the relative abundance of the sum of extracted ion current (m/z 123 + 125 + 137) to highlight the major CYP706A3 primary and volatiles products.
(B) to (E) GC-MS relative quantification of total VOCs emissions (B), TPS11 and TPS21 products (C), TPS24 products (D), and CYP706A3 oxygenated products 1, 2, 3, and 4 (E). VOCs emitted by flowers of different lines were compared with those emitted by Col-0 (100%). Note that the y axis in (C) and (E) are in logarithmic scale. Compounds in (C) and (D) are sorted from the most to least increased in insertion mutants. Data are means ± se of three biological replicates (pooled inflorescences from individual plants). Statistically significant differences relative to Col-0 are indicated (two-tailed Student’s t test: *p < 0.05, **p < 0.01, ***p < 0.001). Statistics can be found in Supplemental Data Set 2.

