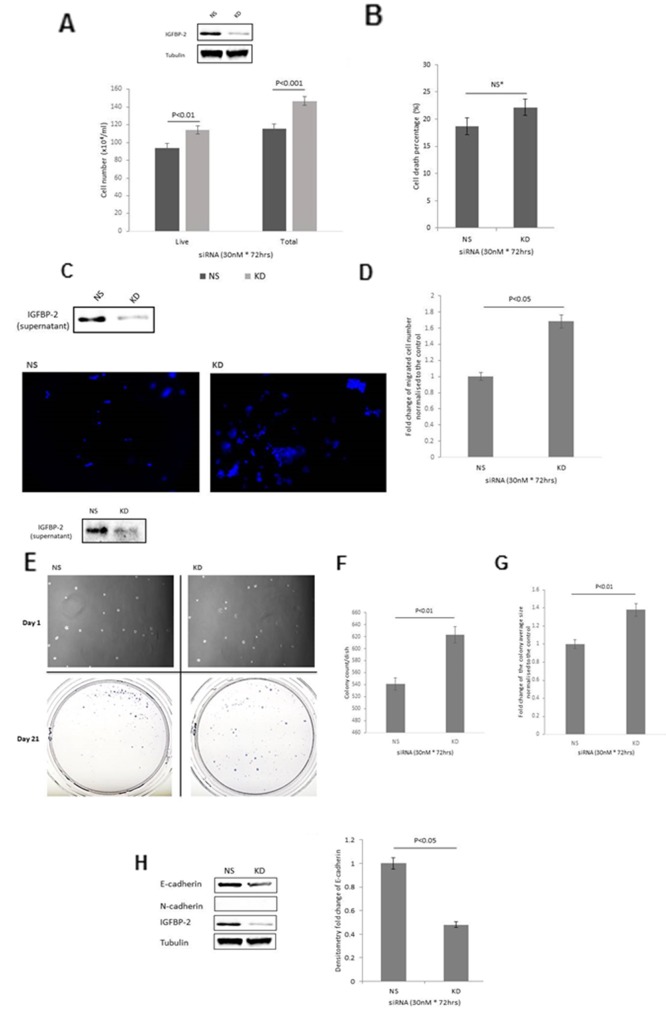
Figure 1.
Shows the effect of IGFBP-2 silencing in RT4 cells on (A) total cell number (B) cell death (C & D) invasion (image shows invaded cells with the nuclei stained with DAPI (in blue); X 10 magification) and graph indicates the mean change in number of invaded cells (E) colony formation; images of cells on day 1 and of colonies on day 21; x 10 magnification. (F&G) graphs represent the change in colony count and fold change of the average colony size respectively. (H) EMT markers, E- and N-cadherin and the graph shows the mean optical density change in E-cadherin. Inserts in A, C, E & H show a Western blot indicating effective IGFBP-2 silencing. Graphs show the mean and SEM of data from 3 separate experiments each performed in triplicate. Data were analysed with SPSS 12.0.1 for Windows using one-way ANOVA followed by least significant difference (LSD) post-hoc test. A statistically significant difference was present at p<0.05. NS= non-silencing control, KD= knockdown with siRNA.

