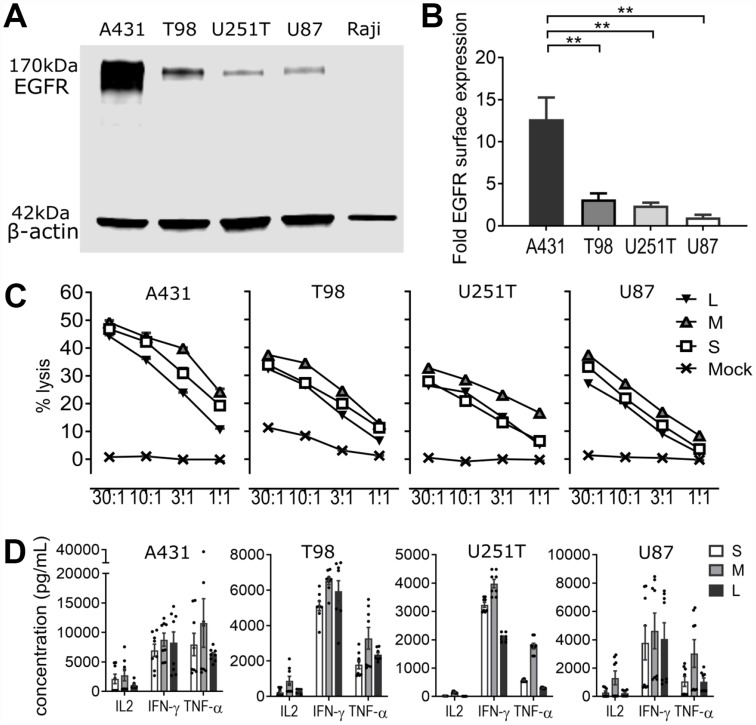
Figure 3. EGFR806-CAR T cells are selectively activated by tumor-specific EGFR expression in vitro.
(A) EGFR quantification in tumor cell lysates via Western blot. Top: EGFR expression in tumor cell lines. Bottom: actin loading control. A431: EGFR+ squamous carcinoma cells (positive control); T98, U251T and U87: glioblastoma cell lines; Raji: EGFR- Burkitt’s lymphoma cells (negative control). (B) Quantification of EGFR surface antigen expression by flow cytometry. The y-axis shows normalized EGFR expression relative to the lowest-expressing U87 cells, ± SEM of three independent experiments. (C) Cytolytic capacity of EGFR806-CAR T cells expressing extracellular spacer variants against EGFR+ tumor cell targets in 4 hr chromium release assay. The x-axis shows the effector: target cell ratio. (D) Cytokine quantification of supernatants obtained from 24 hr co-cultures of EGFR806-CAR T cells and EGFR+ tumor targets at a 2:1 effector: target ratio. Each dot represents an individual replicate, bars show mean ± SEM. Data pooled from two separate experiments with CAR T cells from two different donors. S, short spacer; M, medium spacer; L, long spacer; Mock, untransduced CAR T cell control. ** P < 0.01.

